


4-hour timeframe
Technical data:
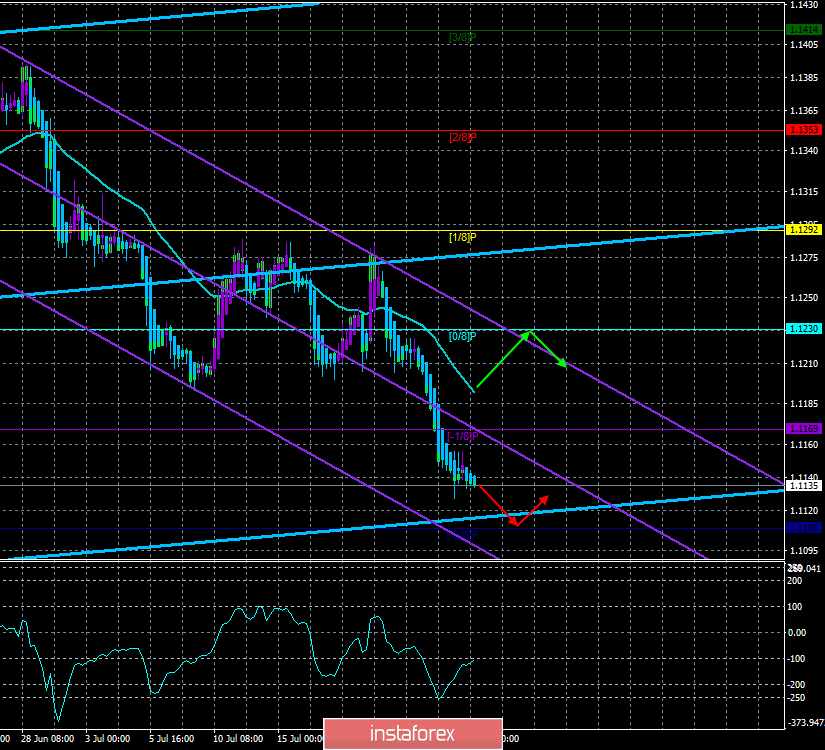
The upper channel of linear regression: direction – up.
The lower channel of linear regression: direction – down.
The moving average (20; smoothed) – down.
CCI: -108.5804
Given the fact that the European currency is cheaper all week, we can assume that traders expect the worst from the ECB, namely an immediate rate cut of 0.10% and statements about the restart of the quantitative easing program in 2019. The most significant indicator of inflation, which is taken into account by the ECB Monetary Committee in determining monetary policy, fell to 1.2-1.3%, which is very small and very far from the target level of the same ECB (2.0%). The regulator even allows the reduction of the target level, realizing that it is impossible to achieve it in the current realities. Just yesterday, we saw the state of business activity in the European Union and, in particular, Germany, the leading economy of the EU; in short, everything is bad. All 6 indicators of business activity indices deteriorated compared to the previous month, and industrial production is in decline. Thus, we believe that the ECB today will lower the rate, and Mario Draghi's comments will be extremely soft. And, accordingly, if the ECB still postpone the easing of monetary policy until September, it can play into the hands of the euro, as it will be perceived as a positive factor. Also today, it is worth paying attention to the report on orders for durable goods in the United States. From a technical point of view, the euro/dollar continues to fall in price without recoil and came close to the annual lows.
Nearest support levels:
S1 – 1.1108
Nearest resistance levels:
R1 – 1.1169
R2 – 1.1230
R3 – 1.1292
Trading recommendations:
The EUR/USD currency pair continues its downward movement. On July 25, therefore, it is still recommended to sell the euro/dollar pair with a target of 1.1108 before the reversal of the Heiken Ashi indicator to the top.
It is recommended to buy the euro in small lots if the bulls manage to return the pair above the moving average line, which will change the trend to the upward one, and the first goal, in this case, will be the level of 1.1292.
In addition to the technical picture should also take into account the fundamental data and the time of their release.
Explanation of illustrations:
The upper linear regression channel – the blue line of the unidirectional movement.
The lower linear regression channel – the purple line of the unidirectional movement.
CCI – the blue line in the indicator window.
The moving average (20; smoothed) is the blue line on the price chart.
Murray levels – multi-colored horizontal stripes.
Heiken Ashi is an indicator that colors bars in blue or purple.


