


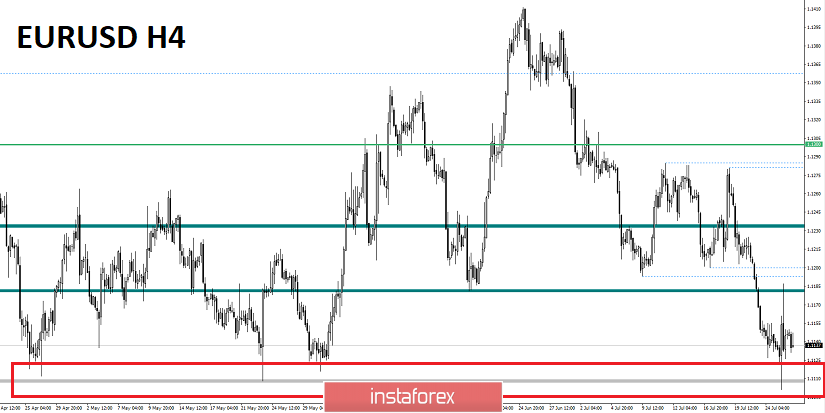
For the last trading day, the euro / dollar currency pair showed a high volatility of 86 points, as a result forming a very interesting amplitude of oscillation. From the point of view of technical analysis, we saw the rally as much in both directions, where two coordinates were touched at once: 1,1100 - a key range level, which keeps us from restoring the global downward trend; 1.1180 is a periodic level, which is the point of the regrouping of trading forces. As discussed in a previous review, traders shared two fronts: First, due to the fear of rapprochement with the key level of 1,1100 and the upcoming ECB meeting, they covered all their short positions; Second, more greedy traders continued to hold short positions, but with a smaller trading volume. What is the result? All were in the black, as the downward movement was and the upward movement too, thereby making it possible for everyone to make money. Considering the trading chart in general terms (daily timeframe), we see that the control point in the form of the range level 1,1100 was affected, but not broken, thus it is too early to talk about the resumption of the global downward trend, but thoughts and theory remain.
The focus of the news background of the previous day, of course, was the ECB meeting, followed by a press conference. A few days before the event, the media and eminent experts foreshadowed a speedy reduction in the interest rate, scaring everyone, of course. Naturally, on this background, we saw a rapid decline throughout the week. The "X" day has come, it turns out, the ECB head, Mario Draghi, throws up his hands, saying that there will be no show - we are diverging. If, of course, his speech was briefly analyzed, the rate was left at the same level, where Draghi added that the rate cut was not already discussed at the meeting today, we want to see the following forecasts before taking action. If we consider the meeting in general terms, the regulator pointed to the possibility of lowering interest rates. Now, the ECB intends to keep rates at their current or lower levels,
And now, we recall the hysteria in the media and my words of yesterday regarding manipulation. Everything falls into place, and someone just earned good money from it.
We return to the news background, yes, it was yesterday, although it remained in the background due to the synchronous release with Mario Draghi. Statistics on durable goods orders in the United States were released, where growth was expected, but an even more beautiful picture was obtained. Previous data on reserves was revised and, it turns out, everything was still not so bad when they wrote about -1.3%, in fact they were -2.3%, where the percentage went, is still not clear. The final data came out with a very good increase of 2.0% with a forecast of 0.7%. Obviously, this news is in the piggy bank of the dollar, but I repeat, the news came out synchronously with the press conference of Mario Draghi and thus remained in the background.
Finally, according to our old tradition, we end this section with a soap opera called "Brexit". The new British Prime Minister, Boris Johnson, in his first speech in this position in parliament, said that Britain was not yet sufficiently ready to leave the European Union without an agreement, until October 31, the possibility of a Brexit deal remains. Boris Johnson also added that he intends to raise negotiations with the EU regarding the terms of the exit and the trade agreement. In turn, European Commission President Jean-Claude Juncker told the new British Prime Minister that the EU's position on the agreement is unchanged. In his opinion, the exit agreement is the best and only possible deal. Perhaps Boris Johnson missed out on attention, as Juncker over the past six months 10 times outlined the position of the EU, but suddenly, he just forgot, it is better to repeat.
Today, in terms of the economic calendar, we have data on GDP (2Q) in the United States, which will certainly interest traders. According to preliminary forecasts, economic growth is expected to slow down from 3.1% to 1.8%.
The upcoming trading week begins with an empty economic calendar, but it is already from Wednesday that a weighty layer of events and statistics awaits us, which costs only one Fed meeting with a possible reduction in the key rate.
The most interesting events are displayed below --->
Wednesday, July 31
EU 09:00 UTC+00 - Consumer Price Index (CPI) (y / y) (July): Prev. 1.3% ---> Forecast 1.2%
United States 15:15 MSK - Change in the number of people employed in the non-farm sector from ADP (July): Prev. 102K ---> 153K forecast
United States 18:00 UTC+00 - Fed interest rate decision: Prev. 2.50% ---> Forecast 2.25%
United States 18:30 UTC+00 - FOMC Press Conference
Thursday, 1 August
EU 08:00 UTC+00 - Manufacturing Business Index (PMI) (July)
United States 14:00 UTC+00 - Manufacturing PMI from ISM (July): Prev. 51.7 ---> Forecast 52.7
Friday, August 2
EU 09:00 UTC+00 - Producer Price Index (PPI) (y / y) (June): Prev. 1.6% ---> Forecast 1.7%
United States 12:30 UTC+00 - Change in the number of people employed in the non-agricultural sector (July): Prev. 224K ---> 160K forecast
United States 12:30 UTC+00 - Unemployment rate (July): Prev. 3.7% ---> Forecast 3.6%
These are preliminary and subject to change.
Further development
Analyzing the current trading schedule, we see that after a kind of rally, the quotation went into the accumulation stage, fluctuating within 1.1130 / 1.1155. Traders are waiting because there are many nuances, all early positions are already closed. The first alignment, which is seen, is to wait, the accumulation in any case will lead to a sharper movement, and now you can relax and stretch from orders. Of course, we do not forget about the upcoming statistics in the form of data on US GDP and the upcoming week, where they plan to lower the key rate, and how painful it did not sound to sellers, there are prerequisites for a weaker dollar, and rather are small ones.
Based on the available information, it is possible to decompose a number of variations, let's consider:
- We consider buying positions in the case of a fix higher than 1.1160. The first perspective is 1.1180, where in the case of a fixation above this value, we can already speak about the progress towards 1.1230-1.1270, but we'll talk about this next week.
- Items for sale, here is not so simple. There is a risk in the form of informational news background, so we wait and analyze for a start a clear fixation lower than 1,1100.
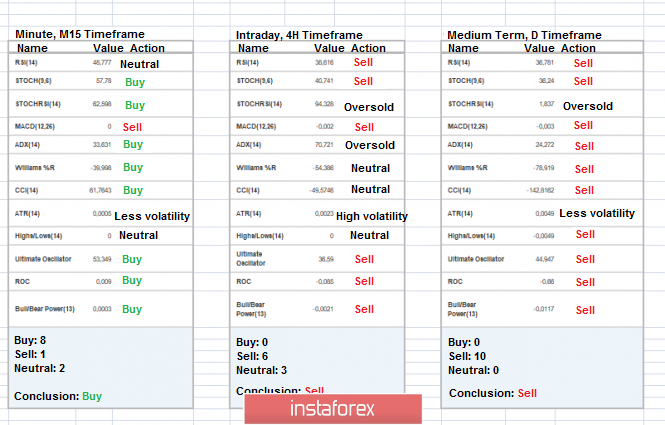
Indicator Analysis
Analyzing a different sector of timeframes (TF), we see that indicators in the short term are variably set to climb, but we are still in a cluster, therefore indicators of change. Intraday and mid-term prospects both retain a descending interest against the general background of the market.
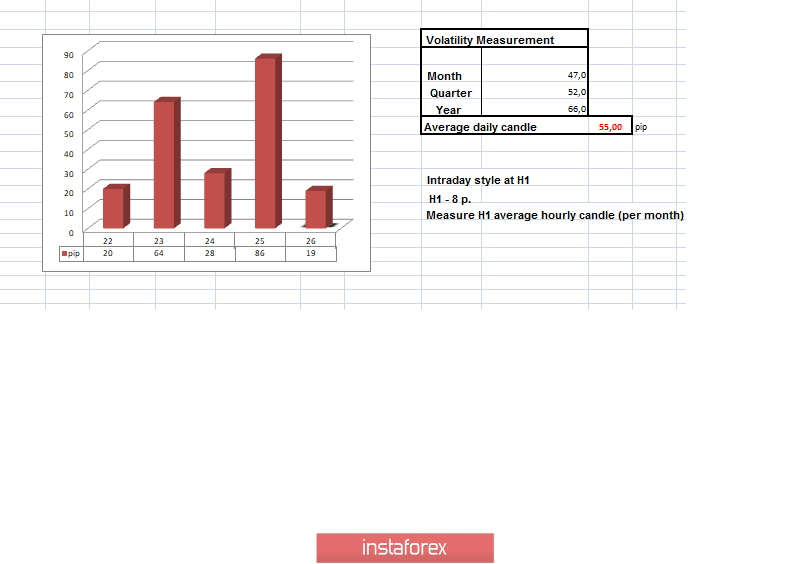
Weekly volatility / Measurement of volatility: Month; Quarter; Year
Measurement of volatility reflects the average daily fluctuation, based on monthly / quarterly / year.
(July 26 was based on the time of publication of the article)
The current time volatility is 19 points. It is likely to assume that due to the accumulation there is still a chance of a surge and thereby an increase in volatility, let's see what will happen at the time of the publication of data on the USA.
Key levels
Zones of resistance: 1.1180 *; 1,1300 **; 1.1450; 1.1550; 1.1650 *; 1.1720 **; 1.1850 **; 1.2100
Support areas: 1,1100 **; 1.1000 ***; 1,0850 **
* Periodic level
** Range Level
*** Psychological level
**** Article is based on the principle of conducting a transaction, with daily adjustment.


