


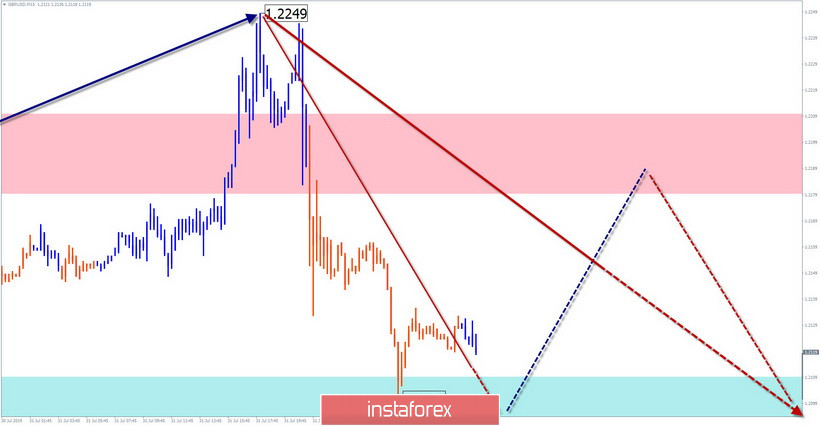
GBP/USD
On the chart of the British pound, the main trend wave has reached a powerful support zone, in which there are several levels of a large scale. The structure of the downward wave that began in March looks complete, but there are no reversal signals on the chart yet. The flat area of the last 2 days began to form an intermediate correction in the form of an expanding triangle.
Forecast:
Today, the most likely scenario for the price movement of the pair will be a flat in the side corridor, between the opposite zones. After an attempt to put pressure on the support, a general upward vector of price fluctuations is expected.
Recommendations:
The pound market is dominated by bearish sentiment and trading against the trend is possible only in the intra-session style. The lot should be reduced as much as possible. It is safer to refrain from trading during the rollback period and look for the sell signals of the instrument at its end.
Resistance zone:
- 1.2180/1.2210
Support zone:
- 1.2110/1.2080
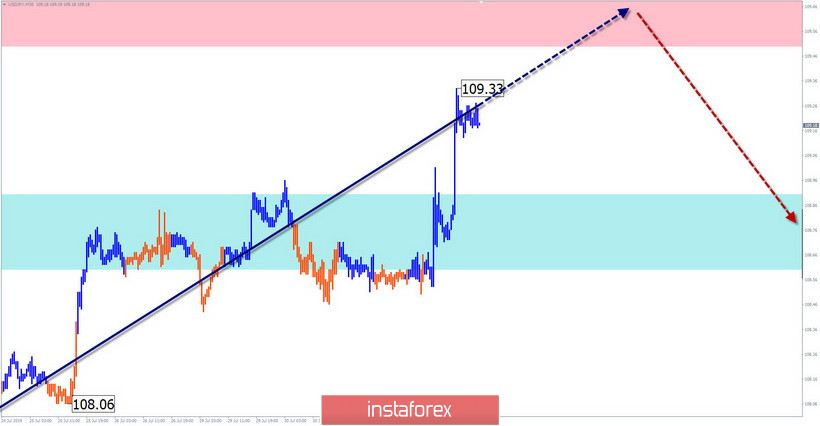
USD/JPY
The direction of the price movement of the yen in recent months is linked to the algorithm of the bullish wave from June 21. Since July 18, its final section has started. The price is approaching the lower limit of the preliminary target zone.
Forecast:
In the first half of the day, an upward vector of movement is expected today, until the completion of the entire current rise. Towards the end of the day, you can wait for the formation of a turn and the beginning of the depreciation.
Recommendations:
Before the appearance of clear signals of a reversal, the pair is premature. When buying yen, one should be careful because of the small range of the expected rise.
Resistance zone:
- 109.50/109.80
Support zone:
- 108.90/108.60
Explanations to the figures: Waves in the simplified wave analysis consist of 3 parts (A-B-C). The last unfinished wave is analyzed. Zones show areas with the highest probability of reversal. The arrows indicate the wave marking according to the method used by the author, the solid background is the formed structure, the dotted ones are the expected movements.
Note: The wave algorithm does not take into account the duration of tool movements over time.


