


EUR/USD
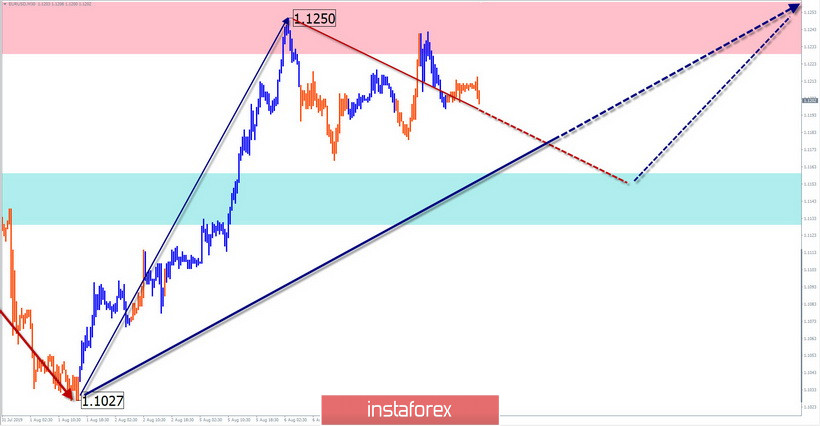
Since August 1, an upward wave structure has been formed on the euro chart, in which a correction develops after the initial impulse. In its structure, a distinctive zigzag is traced, which lacks the final part (C).
Forecast:
Today, the completion of the last 2 days of lateral movement is expected. In the morning, there may be pressure on the resistance zone. Further, a price reduction is expected in the area of settlement support.
Recommendations:
Today, short-term euro sales are possible as part of trading sessions. It is safer to refrain from transactions during the rollback down and look for signals to buy the pair at its end.
Resistance zones:
- 1.1230 / 1.1260
Support zones:
- 1.1160 / 1.1130
GBP/USD
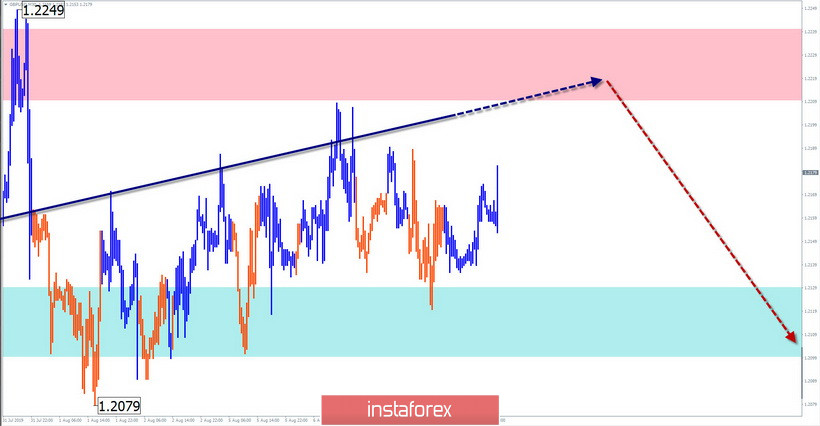
As part of the dominant bearish trend of the British pound, a correctional wave has been forming since the end of July. It develops in the form of a flat, gaining the necessary wave level with numerous zigzags inside the price corridor.
Forecast:
Today, in the morning, an upward vector is more likely, with an attempt to pressure the upper boundary of the channel. The possibility of a short puncture of the upper boundary of the resistance zone is not ruled out. By the end of the day, a return to the main course of movement is expected.
Recommendations:
Pound purchases today are highly risky. In the area of the calculated resistance zone, it is recommended to monitor the signals of your vehicles for the sale of the instrument.
Resistance zones:
- 1.2210 / 1.2240
Support zones:
- 1.2130 / 1.2100
Explanations to the figures: Waves in the simplified wave analysis consist of 3 parts (A-B-C). The last unfinished wave is analyzed. Zones show areas with the highest probability of reversal. The arrows indicate the wave marking according to the method used by the author, the solid background is the formed structure, the dotted ones are the expected movements.
Attention: The wave algorithm does not take into account the length of time the instrument moves.


