


Trend analysis (Fig. 1).
Today, August 26, is a holiday in England and the market will be narrow. The price may continue to move up, with the target of 1.2322 – the resistance line (red bold line), from which the downward movement can begin.
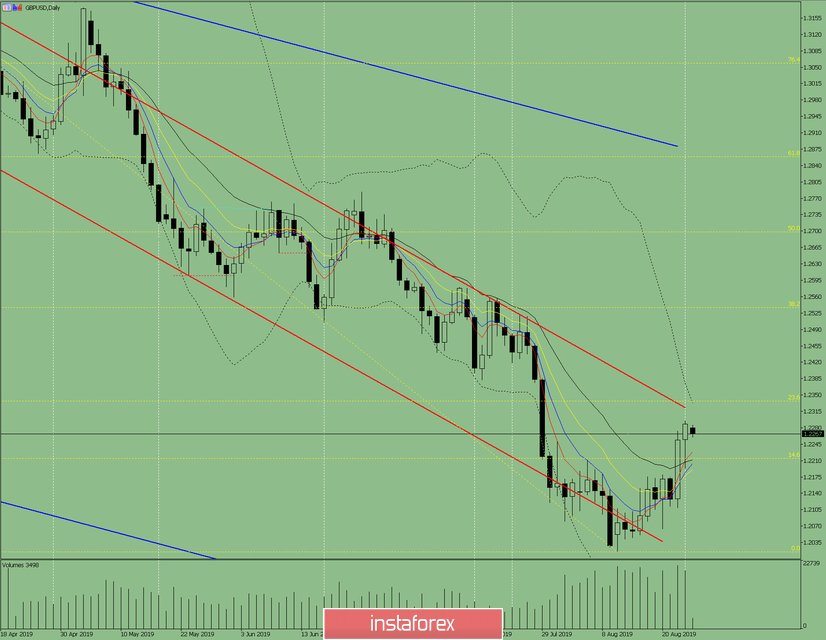
Fig. 1 (daily chart).
Comprehensive analysis:
- Indicator analysis – up;
- Fibonacci levels – up;
- Volume – down;
- Candlestick analysis – neutral;
- Trend analysis – up;
- Bollinger Bands – up;
- Weekly chart – up.
General conclusion:
On Monday, the price may move up.
Possible scenario – after reaching the resistance line of 1.2322, a downward movement is possible with the target of 1.2213 – 21 average EMA (black thin line).


