


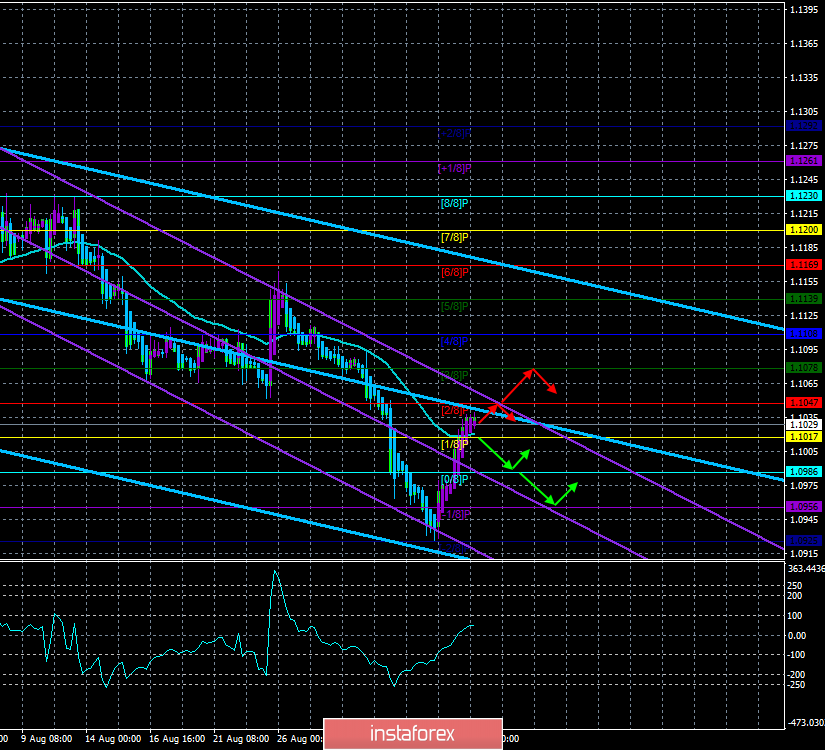
4-hour timeframe
Technical data:
The upper channel of linear regression: direction-down.
The lower channel of linear regression: direction-down.
The moving average (20; smoothed) - sideways.
CCI: 50.3768
The EUR/USD currency pair has fixed above the moving average line, thus, the short-term trend of the pair changed to an upward one. Medium and long-term remained downward, as evidenced by both channels of linear regression. We reviewed the events of yesterday in the final review for September 4. Today, the attention of traders will be focused exclusively on the States, since the news calendar is empty in the eurozone. In America, the ADP report on changes in the number of workers in the private sector, the composite index of business activity, as well as the indices of business activity in the service sector Markit and ISM will be published today. Needless to say, the most important report of today is the ISM index, which last time (the ISM index for the US manufacturing sector) provided tangible support to the euro. As for the forecasts, the ADP report is expected to increase 149,000, the composite index and the Markit index have the same forecast of 50.9, and the ISM index – 54.0 at last month's value of 53.7. Thus, if the real value of the ISM index in August will be below 54.0, you can already expect new purchases of the euro, if below 53.7 (which will indicate a decline in the index itself), the US currency may come under strong pressure, as the index of business activity in the manufacturing sector ISM fell below 50.0 and indicates a decline.
Separately, we would like to focus on the expectations of traders regarding the next meeting of the Fed. The head of the Federal Reserve of St. Louis James Bullard said on Tuesday that "to anticipate the expectations of the markets and to play ahead with the consequences of the trade war with China, you need to lower the key rate by 0.5% at once." "We're too high," Bullard says. The question remains open: did several members of the monetary committee have changed their moods to "dovish" because of Donald Trump's pressure on the Fed or because they believe the risks of a slowdown in the world economy and a trade war are too high? By and large, it is not too important. It is possible that the odious US President realized that it is useless to put pressure on Jerome Powell, but he is not the only one making decisions to change monetary policy. Thus, you can put pressure or perhaps negotiate with several members of the monetary committee – and it's in the hat. Either way, a 0.5% rate cut would be a serious blow to the US currency.
The technical picture allows for further upward movement. As we have said, the main thing is that statistics from the US are not strong today and tomorrow and from the eurozone – weak. And then the bulls will have a chance to develop their success.
Nearest support levels:
S1 – 1.1017
S2 – 1.0986
S3 – 1.0956
Nearest resistance levels:
R1 – 1.1047
R2 – 1.1078
R3 – 1.1108
Trading recommendations:
The euro/dollar pair continues to move upwards. Thus, it is now recommended to consider small lots buying the European currency with the targets of 1.1047 and 1.1078. I recommend returning to sales not earlier than the reverse consolidation of the pair below the moving.
In addition to the technical picture, fundamental data and the time of their release should also be taken into account.
Explanation of the illustrations:
The upper linear regression channel – the blue line of the unidirectional movement.
The lower linear regression channel – the purple line of the unidirectional movement.
CCI – the blue line in the indicator window.
The moving average (20; smoothed) – blue line on the price chart.
Murray levels – multi-colored horizontal stripes.
Heiken Ashi is an indicator that colors bars in blue or purple.


