


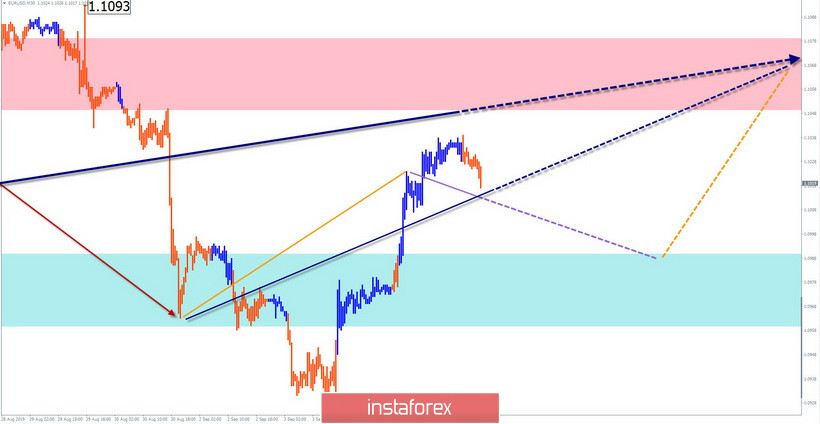
EUR/USD
On the euro chart, the upward wave model from August 1 continues to develop. The wave has an irregular appearance, with the elongation of the middle part down. At the end of August, the final part (C) started. The price is approaching the resistance zone of a large TF.
Forecast:
The price of the pair between today will be between the nearest zones. A decline is expected in the morning. The most likely site of its completion is marked by a support zone. Price growth can begin at the end of the day or tomorrow.
Recommendations:
Today, intraday trading is relevant according to the described algorithm. When selling, it makes sense to reduce the lot size. The main emphasis should be on tool purchases.
Resistance zone:
- 1.1050/1.1080
Support zone:
- 1.0990/1.0960
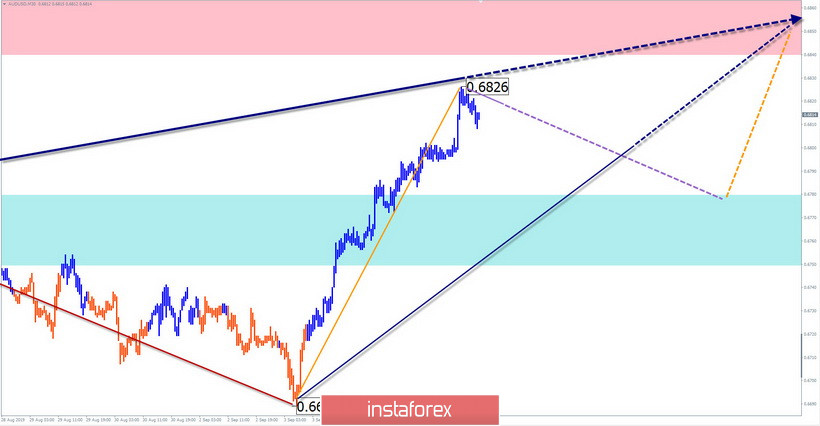
AUD/USD
On the chart of the Austrian dollar, the formation of the upward wave from August 7 continues. The wave has the form of an elongated standard plane. Since September 3, the final part of the design is developing. The preliminary target area is within the resistance zone.
Forecast:
In the next session, the price of the pair is waiting for a rollback. Most likely, it will look like a flat, but the short-term decline is not excluded. A return to the main intersessional trend rate can be expected at the end of the day.
Recommendations:
Aussie sales today are not very promising. It is necessary to reduce the lot and close sales at the first signs of a reversal. It is wiser to refrain from trading during the pullback down and to look for signals to enter long positions at its end.
Resistance zone:
- 0.6840/0.6870
Support zone:
- 0.6780/0.6750
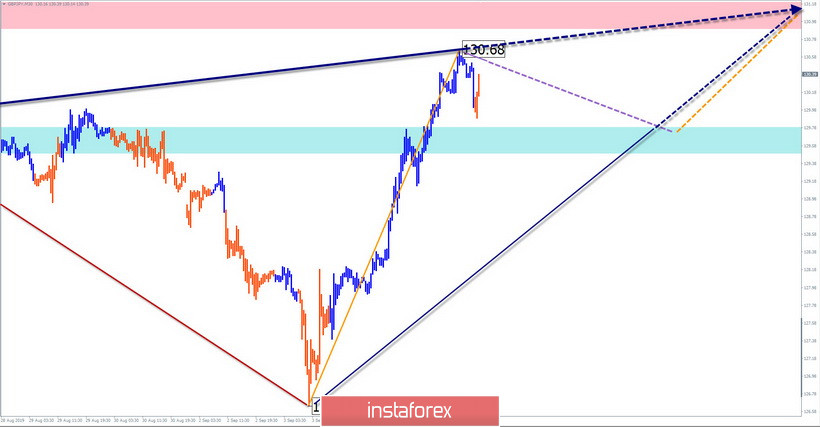
GBP/JPY
On the cross chart, as a result of successive price movements, the last wave structure was determined, with a reference point on August 5. This is a bullish stretched plane forming an expanding triangle on the chart. The final part (C) started in its structure on September 3.
Forecast:
After the initial breakthrough, the pair are expecting a pullback in the upcoming sessions. The flat may be delayed for a whole day. In the US trading session, an increase in volatility and a return of the cross to an upward course is likely.
Recommendations:
Sales of the pair today are risky and unpromising. The optimal tactic would be to stay out of the market for the time of rollback, and then look for the opportunity to buy the instrument.
Resistance zone:
- 130.90/131.20
Support zone:
- 129.80/129.50
Explanations to figures: Waves in the simplified wave analysis (UVA) consist of 3 parts (A-B-C). Analyzes the last unfinished wave. Zones show the areas with the highest probability of reversal. Arrows indicate the wave count used by the author to the method, a solid background structure for determining the expected movement.
Attention: The wave algorithm does not take into account the length of time the instrument moves.


