


To open long positions on EURUSD, you need:
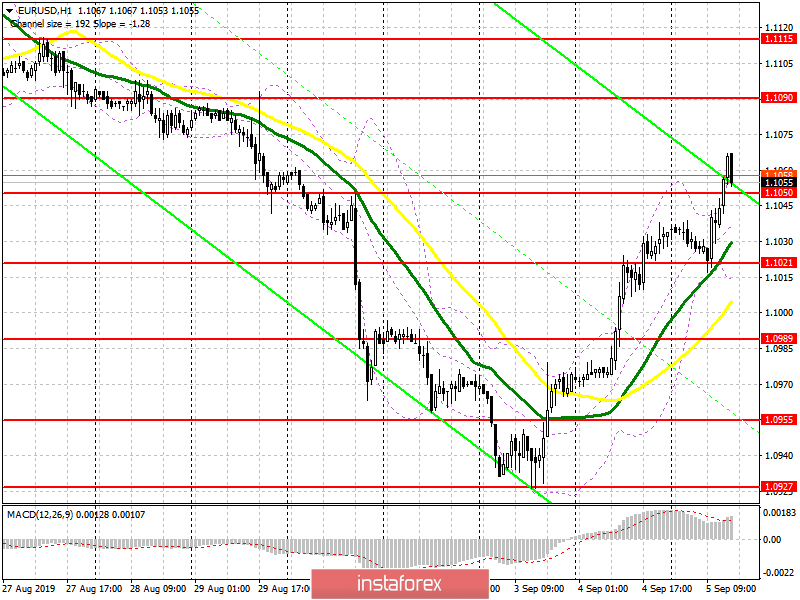
Despite the absence of important fundamental statistics in the first half of the day, the bullish momentum on the euro continued, which allowed getting to the level of 1.1050, which is now quite an important support. As long as trading is above this range, the demand for the euro will continue, which may lead to an update of the highs in the area of 1.1090 and 1.1115, where I recommend fixing the profits. If the bears manage to take control of the market, and the pair returns to the support of 1.1050, it is best to count on new long positions on a false breakdown from the level of 1.1021, or a rebound from a minimum of 1.0990.
To open short positions on EURUSD, you need:
In the first half of the day, sellers failed to form a false breakdown in the resistance area of 1.1050, but the divergence that has now formed on the MACD indicator on the hourly chart can return EUR/USD to this level of support, which will be the first signal to open short positions. The first intermediate goal will be the area of 1.1021, however, it is best to take profits at a minimum of 1.0990. In the scenario of further growth of the euro according to the trend, it is possible to consider new short positions on a rebound from a maximum of 1.1090.
Signals:
Signals of indicators:
Trading is above 30 and 50 moving averages, indicating a bullish market.
Bollinger Bands
In the case of a decrease in the euro, the lower limit of the indicator at 1.1015 will limit the downward potential.
Description of indicators
- MA (moving average) 50 days – yellow
- MA (moving average) 30 days – green
- MACD: fast EMA 12, slow EMA 26, SMA 9
- Bollinger Bands 20


