


Trend analysis (Fig. 1).
On Friday, the price, after testing the resistance line, may begin to move down with the target of a pullback level of 14.6% - 1.2296 (blue dashed line) and in case of breaking further down to a pullback level of 23.6% - 1.2261 (blue dashed line).
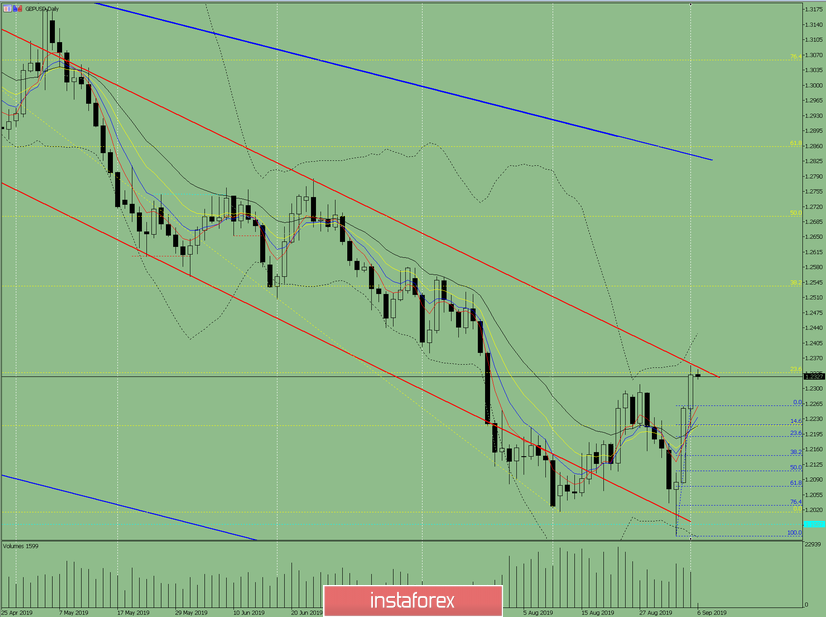
Fig. 1 (daily chart).
Comprehensive analysis:
- indicator analysis - up;
- Fibonacci levels - down;
- volumes - down;
- candlestick analysis - down;
- trend analysis - down;
- Bollinger Lines - up;
- weekly schedule - down.
General conclusion:
On Friday, the price, after testing the resistance line, may begin to move down with the target of a pullback level of 14.6% - 1.2296 (blue dashed line) and in case of breaking further down to a pullback level of 23.6% - 1.2261 (blue dashed line).
An unlikely scenario is an upward movement, with the first target of 1.2387 - the upper boundary of the Bollinger Line indicator (black dashed line).


