


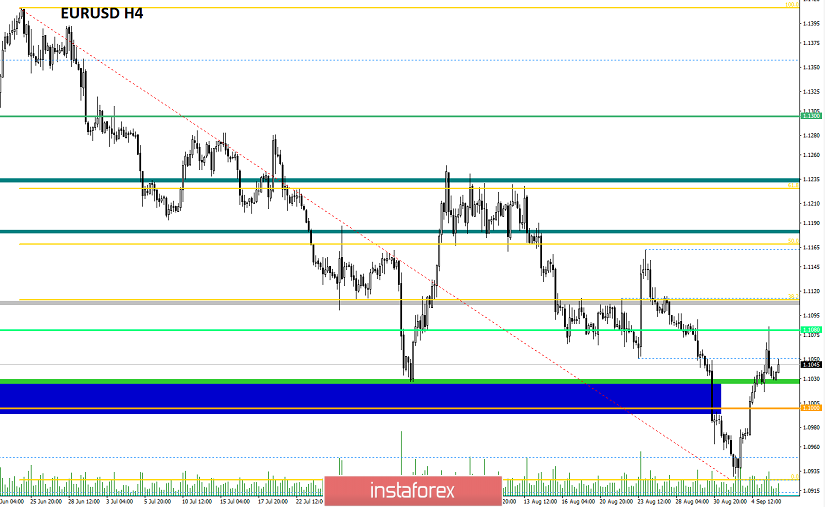
Over the past trading day, the currency pair euro / dollar pleased with the high volatility of 67 points again, as a result of which the quotation rushed to the cluster area in mid-August. From the point of view of technical analysis, we see that the correctional course from the values of 2017 has already reached the level of 1.1080. This, by the way, is more than 150 points of the upward movement. As you understand, the level of 1.1080 is a mirror level, relative to which a slowdown in the form of quotation accumulation previously occurred.
As discussed in a previous review, speculators do not sleep and continue to work on the corrective course. The judgment is that the upward movement will continue to coincide 100%, as the quote managed to reach 1.1070-1.1080. The profit received is relatively small, but along with all the actions within the week, we have a decent profit. In turn, conservative traders again sat on the fence, waiting for the return of the quotation below the psychological mark of 1.1000. Considering the trading chart in general terms (daily period), we see that the corrective move in the global downward trend is still preserved in the market, where the mid-August cluster, together with the Fibo level of 38.2, is located before the quote. As you know, it's still very early to talk about a change in the global trend. Thus, it's better to analyze the 2015-2017 section to be ready for anything. Do you understand the hint?
The news background of the past day contained ADP data on US employment, where, of course, everyone expected a decrease in growth rates from 156 thousand to 149 thousand. As a result, the previous data was revised for the worse, and the current data came out with very good growth, 142 thousand. ---> 195 thousand. In addition to everything, we were pleased with the data on the number of applications for unemployment benefits, which fell by 38 thousand with a forecast of a decrease of 17 thousand. The finish line of the extravaganza of statistics in the United States was data on the volume of industrial orders and business activity in non-production sector where we see significant growth in both areas. How did the American dollar react to all this? At first, the dollar was losing its position without even noticing the key news of ADP, but closer to 14:00 Universal time, the picture changed, and the positions on the green piece of paper began to grow. The reason for such an extraordinary market reaction lies precisely in the information background, in particular Brexit. Therefore, the panic in the United Kingdom does not abate, the draft law on forced delay in the absence of agreements with the EU has already been approved by the House of Lords, and the brother of Prime Minister Boris Johnson announced his resignation from Parliament, as well as from the post of Minister for Universities and Science Affairs. Joe Johnson said that he was torn between family loyalty and national interests, so he will leave the government. This kind of step is clearly a stone in the garden of the current Prime Minister, and, as a fact, further panic leaps. Thus, how good the statistics for the States were, the synchronous publication of the news and informational background played the role of a veil, and we saw a belated reaction.
Today, in terms of the economic calendar, we have a report from the United States Department of Labor, which predicts a reduction in the number of people employed in the non-agricultural sector from 164K to 160K. But if you refer to the ADP data, as written above, there is a high probability that the report will come out with a much better forecast than expected. Thus, the reaction that we saw yesterday was delayed, paired with new data, could play into the hands of the American dollar.
The upcoming trading week in terms of the economic calendar begins rather sluggish. But by the middle of the week, we will have an acceleration, which is only worth the ECB meeting, where they plan to reduce the rate on deposits. At the same time, no one forgets about the information background, which can unfold in the form of discussions on the postponement of Brexit.
The most interesting events displayed below --->
Tuesday September 10th
USA 14:00 Universal time. - The number of open vacancies in the labor market JOLTS (July): Prev. 7.348M
Wednesday, September 11
USA 12:30 Universal time. - Producer Price Index (PPI) (YoY) (Aug): Prev 1.7% ---> Forecast 1.7%
Thursday, September 12
EU 9:00 Universal time - Industrial Production (YoY) (July): Prev -2.6% ---> Forecast -1.2%
ECB meeting, followed by a press conference
EU 11:45 Universal time - Deposit rate (Sep): Prev -0.40% ---> Forecast -0.50%
USA 12:30 Universal time. - Core Consumer Price Index (CPI) (YoY) (Aug): Prev 2.2% ---> Forecast 2.2%
Friday September 13
USA 12:30 Universal time. - Retail Sales (YoY) (Aug): Prev 3.4% ---> Forecast 3.2%
Further development
Analyzing the current trading chart, we see that after a small pullback from the level of 1.1080, the quotation stopped at around 1.1030, where there is a clear restraint. Traders, in turn, hid, as there are prerequisites for the restoration of the main movement, and work in the correction may come to an end.
It is likely to assume a temporary amplitude in the region of 1.1030-1.1080, where it is worthwhile to carefully analyze the price fixing points. If the forecast is confirmed and the price is fixed lower than 1.1030, it is likely to expect a decline to 1.1000, after which we analyze the price behavior relative to the psychological level, where there will be a chance of further topping up of short positions. The plot is quite realistic, but there is only one. If there will be a wide informational background again, then the plot may change, so we should closely monitor the news feed.
Based on the above information, we derive trading recommendations:
- Buying positions are considered in the case of price fixing higher than 1.1080, not puncture, with the prospect of a move to 1.1110.
- Selling positions are considered if prices are fixed lower than 1.1030, with the prospect of a move to 1.1000 --- 1.0980 ---- 1.0940.
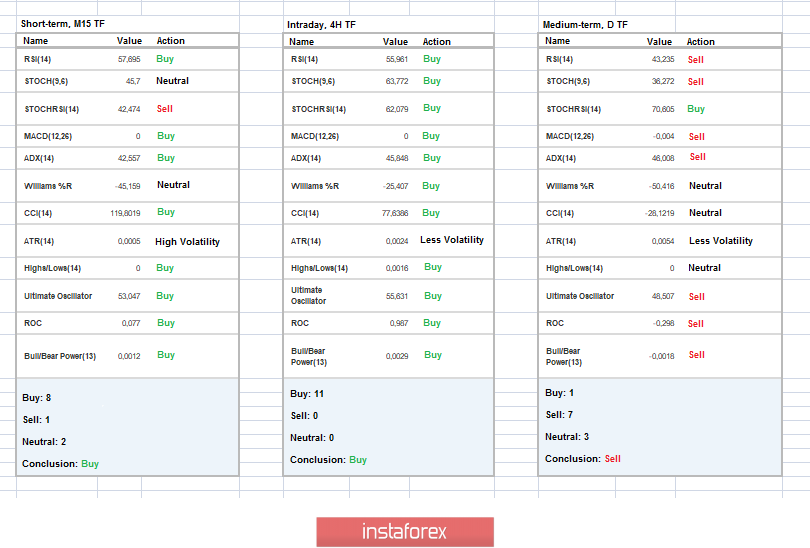
Indicator analysis
Analyzing a different sector of timeframes (TF), we see that indicators in the short and intraday perspective have upward interest, reflecting the current corrective movement. Meanwhile, mid-term indicators follow the main market movement - downward interest.
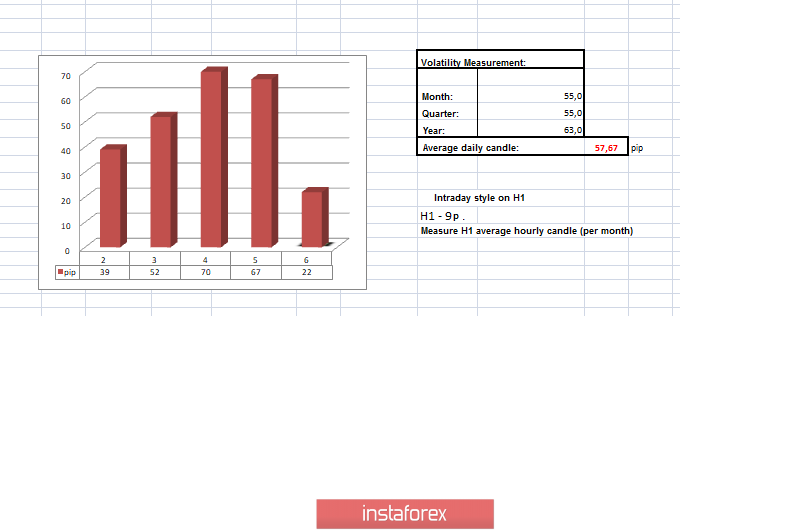
Volatility per week / Measurement of volatility: Month; Quarter; Year
Measurement of volatility reflects the average daily fluctuation, calculated for the Month / Quarter / Year.
(September 6 was built taking into account the time of publication of the article)
Current time volatility is 22 points. It is likely to assume that due to the information and news background, volatility may increase, exceeding the daily average.
Key levels
Resistance zones: 1,1100 **; 1,1180 *; 1.1300 **; 1.1450; 1.1550; 1.1650 *; 1.1720 **; 1.1850 **; 1,2100
Support Areas: 1,1000 ***; 1.0850 **; 1,0500 ***; 1.0350 **; 1,0000 ***.
* Periodic level
** Range Level
*** Psychological level
**** The article is built on the principle of conducting a transaction, with daily adjustment


