


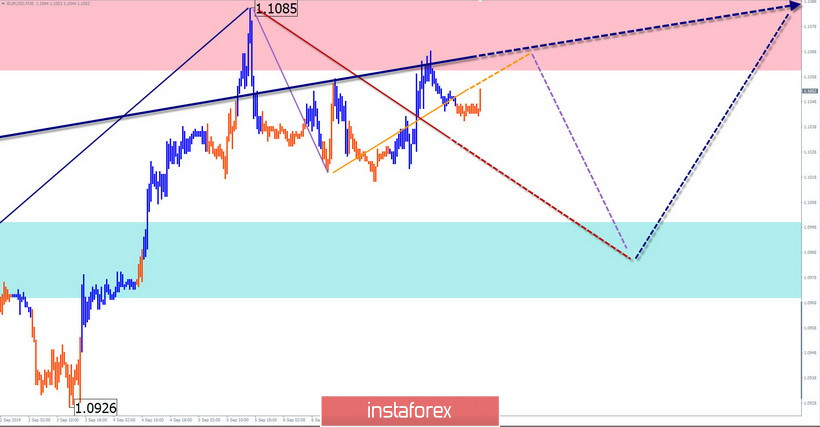
EUR/USD
On the euro chart, the last wave of short-term trading started on September 3 and is directed upwards. It completes the upward model of a larger scale on August 1. The price is at a strong resistance level, the image of an intermediate correction. Its structure at the time of analysis is not complete.
Forecast:
Today, it is expected to continue the formation of the downward movement, which began 3 days ago. Before the start of the decrease, the second attempt of pressure on the resistance zone is possible. The support zone shows the most probable area of correction completion.
Recommendations:
Euro purchases are premature today. Supporters of intraday can make short-term sales of the pair. It is safer to refrain from entering the pair market at the time of the pullback and look for buy signals at its end.
Resistance zone:
- 1.1060/1.1090
Support zone:
- 1.1000/1.0970
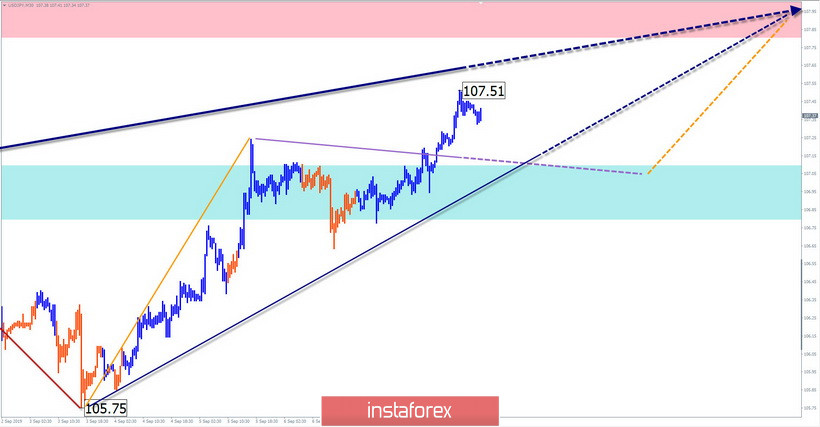
USD/JPY
On August 6, a rising stretched plane has been developing on the chart of the major yen pair. The current potential of the wave already exceeds the level of the rollback of the last section of the previous trend. The price is approaching the lower border of the wide potential reversal zone of a large TF.
Forecast:
In the first half of the day, the price is likely to roll back down. The swing range limits the support area. By the end of the day, a return to the main rate of the current intraday trend is expected.
Recommendations:
Yen sales today are risky and unpromising. It is recommended to skip the decline section and monitor the instrument purchase signals in the support zone.
Resistance zone:
- 107.80/109.10
Support zone:
- 107.10/106.80
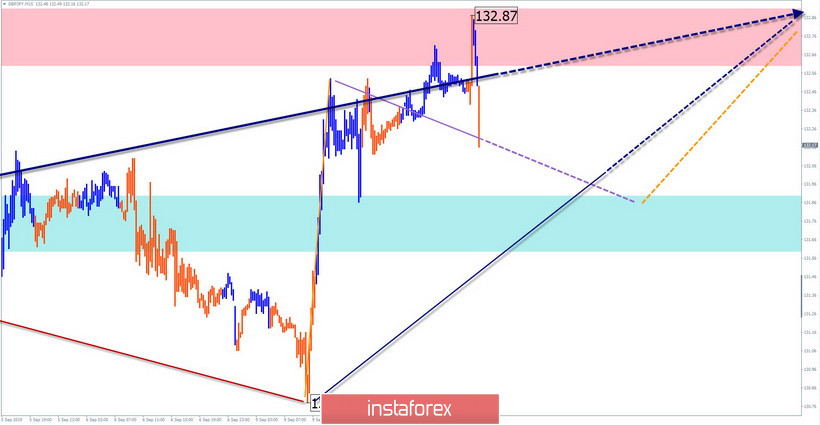
GBP/JPY
Since August 5, an upward wave structure with a reversal potential has been developing on the currency pair chart. The first 2 parts (A + B) are fully formed in the structure, the final part (C) develops.
Forecast:
Preliminary calculations of the target zone give as a guide the beginning of the 136th figure. Before a further upward trend, the price is expected to roll back down. Its completion is most likely in the area of the support zone. A return to the upward movement vector can be expected at the end of the day or tomorrow.
Recommendations:
Sales of the pair today are possible within the day's trading. The lot is more reasonable to reduce. The optimal tactic is to skip the decline phase and search for the pair buy signals at its end.
Resistance zone:
- 132.60/132.90
Support zone:
- 131.90/131.60
Explanations to figures: Waves in the simplified wave analysis (UVA) consist of 3 parts (A-B-C). The last, incomplete wave is analyzed. Zones show the areas with the highest probability of reversal. The arrows indicate the wave marking according to the method used by the author, the solid background is the structure formed, the dotted one is the expected movements.
Attention: The wave algorithm does not take into account the length of time the instrument moves.


