


Trend analysis (Fig. 1).
On Tuesday, the price may continue to move down to a pullback level of 23.6% - 1.2377 (blue dotted line). If this level is broken, the continuation of the downward movement to the pullback level of 38.2% - 1.2297 (blue dashed line) is possible.
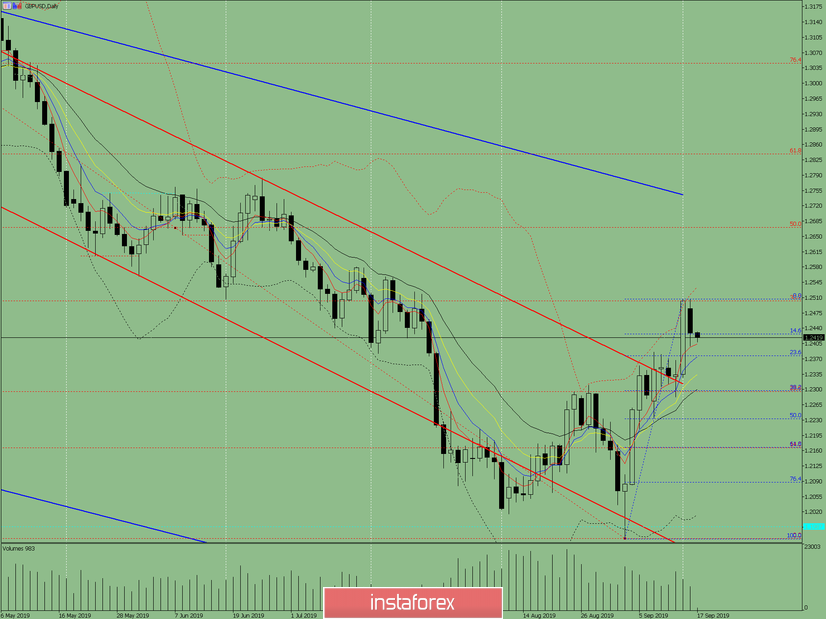
Fig. 1 (daily chart).
Comprehensive analysis:
- indicator analysis - down;
- Fibonacci levels - down;
- volumes - down;
- candlestick analysis - down;
- trend analysis - up;
- Bollinger Lines - down;
- weekly schedule - up.
General conclusion:
On Tuesday, the price may continue to move down.
An unlikely scenario is to work up with the target at 1.2507 (upper fractal).


