


Trend analysis (Fig. 1).
On Monday, the price may continue to move down to a pullback level of 23.6% - 1.2435 (blue dotted line) and in case of breaking through, further down to 1.2364 - 21 average EMA (black thin line).
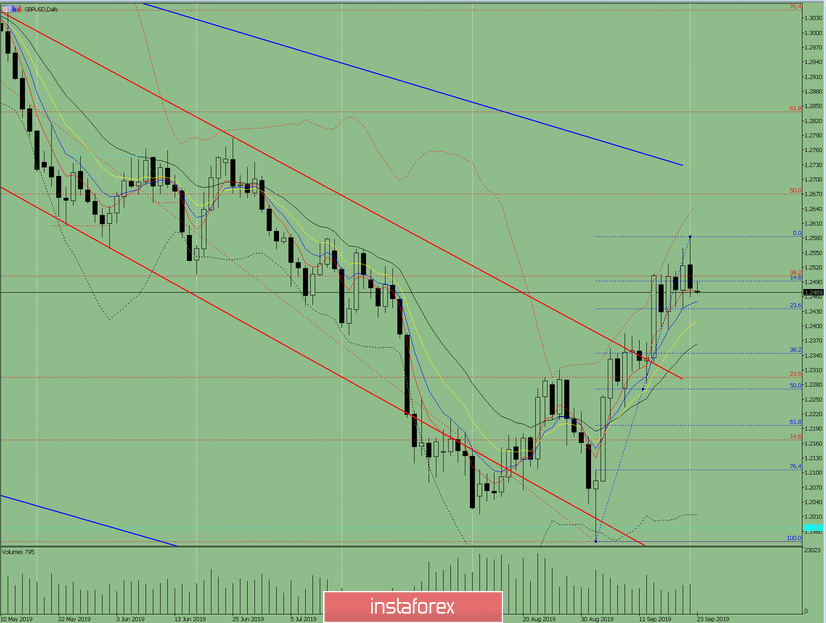
Fig. 1 (daily chart).
Comprehensive analysis:
- indicator analysis - down;
- Fibonacci levels - down;
- volumes - up;
- candlestick analysis - down;
- trend analysis - up;
- Bollinger Lines - up;
- weekly schedule - up.
General conclusion:
On Monday, the price may continue to move down.
An unlikely scenario is an upward movement, with the target at 1.2583 - an upper fractal.


