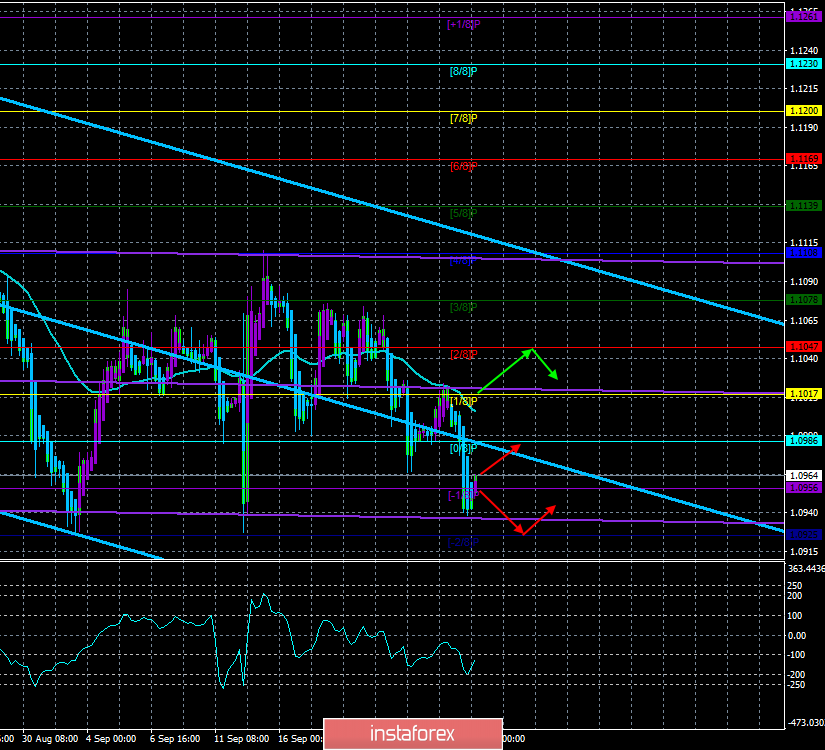
4-hour timeframe

Technical data:
The upper channel of linear regression: direction – down.
The lower channel of linear regression: direction – sideways.
The moving average (20; smoothed) – down.
CCI: -123.3835
In yesterday's morning article, we wrote that Wednesday is a great day to understand what is the true mood of traders regarding the EUR/USD pair. No macroeconomic publications were planned for this day, so the flat could indicate that market participants are waiting for news and are not ready to "rush into battle" without new fundamental information. However, in reality, the US dollar rose again, and the euro/dollar pair fell to two-year lows for the third time. Thus, from our point of view, this moment perfectly shows that the mood of traders remains frankly bearish. Based on yesterday's fall, we can expect it to continue today and tomorrow either immediately or after a slight upward correction. Of course, several factors speak in favor of the possible growth of the pair. For example, the pattern "triple bottom", which is imperceptibly formed from the pattern "double bottom". For example, a rebound from the level of 1.0940. But most trend indicators are still pointing downwards.
As for the number 1 topic of the last days – a possible impeachment of Donald Trump – it is certainly interesting, but, as we see, it does not have a special impact on the pair. Yesterday, when it became known about the beginning of this procedure and the investigation against Trump, the dollar continued to grow, as if nothing had happened. Although a more logical reaction of the market to such a serious and important procedure against the US President would be the sale of the dollar. Thus, traders continue to pay more attention to economic indicators and actions (statements) of the US and EU regulators.
On Thursday, September 26, several macroeconomic reports and a speech by Mario Draghi are planned. The index of spending on personal consumption, the annual GDP data for the second quarter in the US – something that traders will pay attention to today. Although the big question arises, do traders need new strong data from America to continue buying the dollar? The main thing is that the balance between the rates of the ECB and the Fed remained in favor of the latter, and the US economic data in the aggregate is stronger than the European ones. As for Mario Draghi's performance, everything is obvious. When was the last time Mario Draghi delighted the markets? When was the last time the rhetoric of the head of the ECB was at least "neutral"? Today, with a probability of 90%, Draghi's speech will consist of his "fears", weak forecasts, words about recession and low inflation. That is, in the best case for the euro, Draghi should not touch on the topic of monetary policy and the economy of the European Union. Otherwise, traders will get new grounds for purchases of the US currency.
The technical picture shows the continuation of the downward trend, but now an upward correction is possible, as traders failed to overcome the support area of 1.0940 – 1.0926 for the third time. The color of 1-2 bars of the Heiken Ashi indicator in purple will indicate the beginning of the correction.
Nearest support levels:
S1 – 1.0956
S2 – 1.0925
Nearest resistance levels:
R1 – 1.0986
R2 – 1.1017
R3 – 1.1047
Trading recommendations:
The euro/dollar pair resumed its downward movement, but today it may begin to adjust. Thus, it is recommended to either remain in sales with the target of 1.0925 until the Heiken Ashi turns up or to open a new sell position after the correction is completed.
In addition to the technical picture, fundamental data and the time of their release should also be taken into account.
Explanation of illustrations:
The upper linear regression channel – the blue line of the unidirectional movement.
The lower linear regression channel – the purple line of the unidirectional movement.
CCI – the blue line in the indicator window.
The moving average (20; smoothed) – the blue line on the price chart.
Support and resistance – red horizontal lines.
Heiken Ashi – an indicator that colors bars in blue or purple.


