


Trend analysis.
This week, the price will move down with the first target of 1.2195 – a pullback level of 61.8% (blue dotted line). If achieved, continue the downward work.
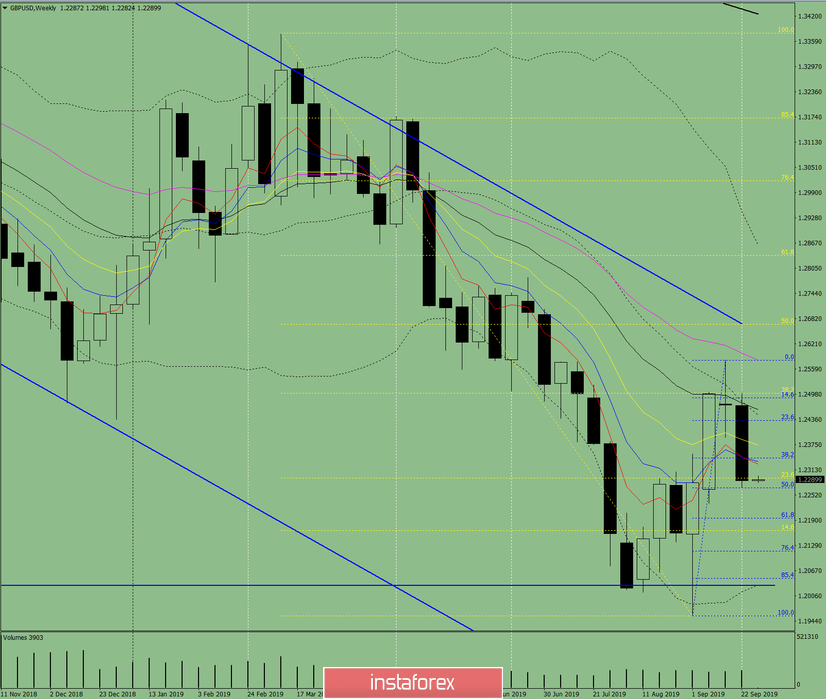
Fig. 1 (weekly chart).
Complex analysis:
- Indicator analysis – down;
- Fibonacci levels – down;
- Volumes – down;
- Technical analysis – down;
- Trend analysis – down;
- Bollinger Bands – down;
- Monthly chart – down.
The conclusion of the complex analysis – a downward movement.
The overall result of calculating the candle of the GBP/USD currency pair according to the weekly chart: the price for weeks will most likely have a downward trend with the absence of the first upper shadow of the weekly black candlestick (Monday – down) and the absence of the second lower shadow (Friday – down).


