


Trend analysis (Fig. 1).
On Tuesday, the price may continue to move down to the lower fractal - 1.2271 (red dashed line). In case of breaking through this level, the continuation of the downward movement to the pullback level of 61.8% - 1.2198 (blue dotted line) is possible.
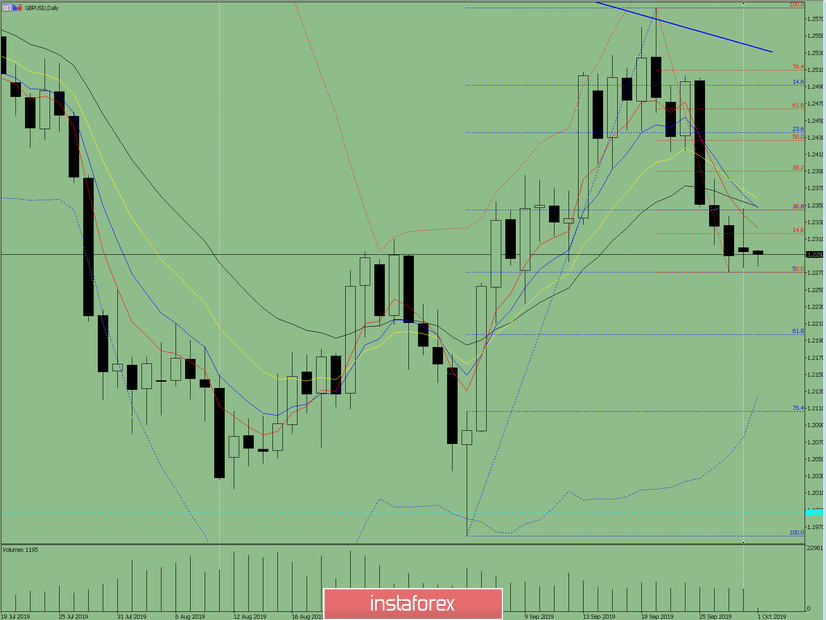
Fig. 1 (daily chart).
Comprehensive analysis:
- indicator analysis - down;
- Fibonacci levels - down;
- volumes - down;
- candlestick analysis - up;
- trend analysis - down;
- Bollinger Lines - down;
- weekly schedule - up.
General conclusion:
On Tuesday, the price may continue to move down.
From the pullback level of 50.0% - 1.2271 (red dashed line), an upward rollback is possible with the target of 1.2317 (red dashed line). In addition, the downward trend is continuing.


