


Trend analysis.
In October, it is possible to move upward with the target of 1.2881 – a pullback level of 38.2% (blue dotted line). On the way up, there are strong levels from which it is possible to roll back down, and therefore there will be good entry points upward. This is a pullback level of 23.6% - 1.2524 (blue dotted line).
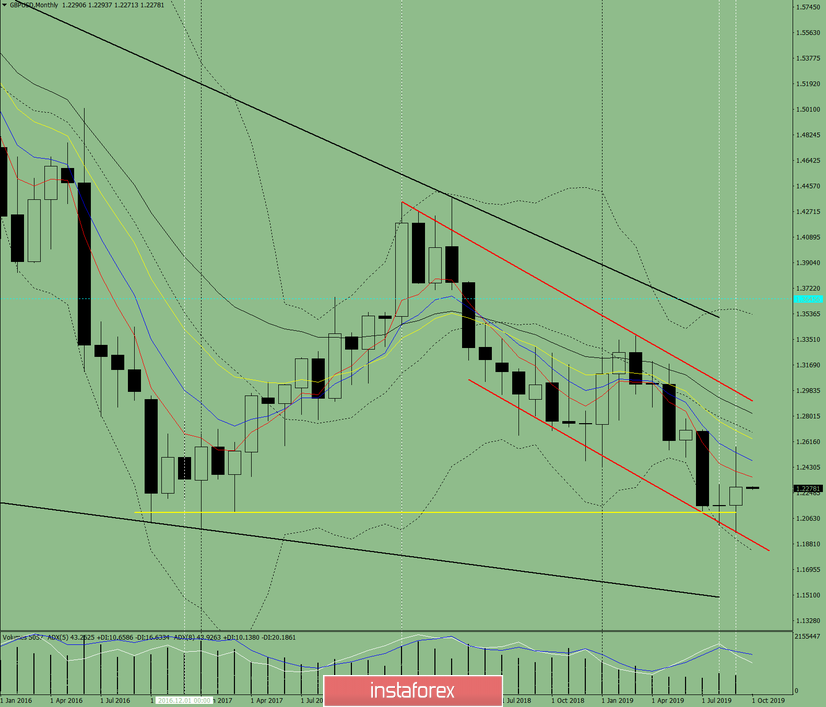
Fig. 1 (monthly chart).
Indicator analysis:
- Indicator analysis – up;
- Fibonacci levels – up;
- Volumes – up;
- Candle analysis – up;
- Trend analysis – up;
- Bollinger Bands – down;
Conclusion on a comprehensive analysis - the upper hand is possible.
The total result of calculating the candle of the GBP/USD currency pair according to the monthly chart: the price is likely to have an upward trend with the absence of the first lower shadow (the first week of the month – white) and the absence of the second upper shadow (last week is white).


