


4-hour timeframe
Technical data:
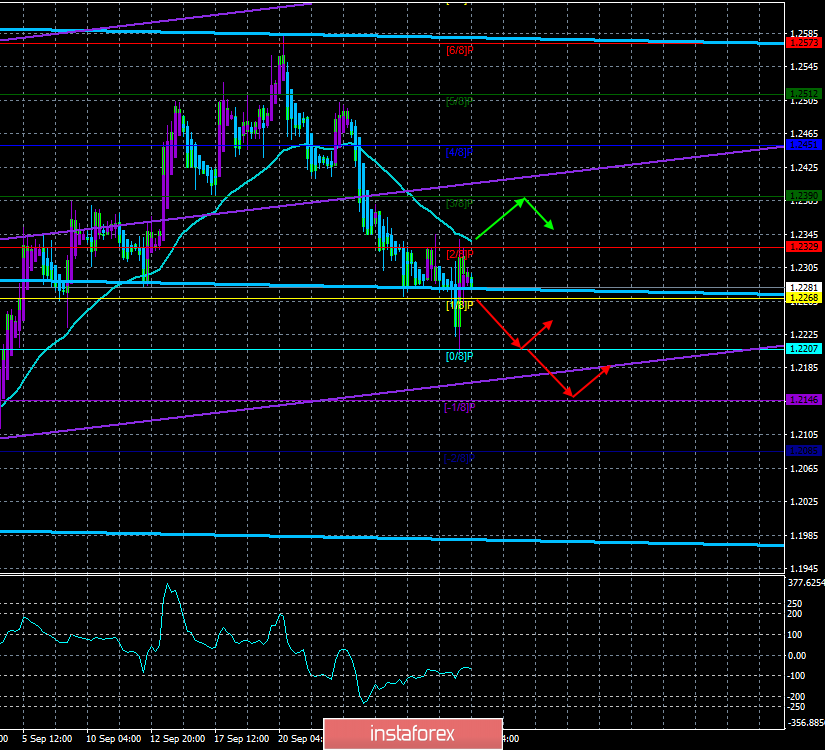
The upper channel of linear regression: direction – sideways.
The lower channel of linear regression: direction – upward.
The moving average (20; smoothed) – down.
CCI: -71.3906
Over the past trading day, the pound, as well as the euro, managed to adjust to the moving average line, thanks to the same index of business activity in the manufacturing sector ISM. In addition to this report, a similar index was published in the UK itself, which showed a small increase to 48.3. However, this value of the indicator still indicates a decline in the industry, so the British currency was not supported.
Much more interesting data comes, as usual, from Parliament. First, it became known that Boris Johnson still came up with an alternative "backstop" plan and has even discussed it with the leaders of the European Union. Brussels's reaction to Johnson's proposal is still unknown, and the plan itself is covered only superficially by media. Its essence is that Northern Ireland after Brexit will continue to be part of the EU single market until 2025 while leaving the Customs Union. Regarding the border between Ireland and Northern Ireland, the plan calls for the introduction of two new temporary borders for the island of Ireland, as well as for the Irish Sea. It is still difficult to imagine what the British Prime Minister's plan is in practice. However, according to many experts and political analysts, even if the EU likes this idea, which is not a fact, the UK has very little time to formalize all aspects of the plan legally, to agree not only on the main essence with the EU, but also on all minor issues, before the summit on October 17/18, which is two weeks away. Thus, we also believe that this plan is only necessary to once again create the appearance of active action and an irresistible desire of Johnson to negotiate with Brussels.
Secondly, it became known what opinion the opposition holds on the issue of a vote of no confidence in Boris Johnson. As it was said earlier, it does not make sense for the Opposition forces to initiate a vote or impeachment before the official postponement of Brexit to a later date since such options can lead to early elections in Parliament, which Johnson is seeking. One of the leaders of the Labor Party, John McDonnell, said that the issue of a vote would be on the agenda if negotiations on the "deal" fail on October 17/18. Or if Boris Johnson tries to break the law to block the "hard" Brexit, adopted by Parliament. Thus, both sides are waiting for the EU summit, and we are also waiting for the response of the leaders of the European Union to Johnson's "super plan".
From a technical point of view, the picture for the GBP/USD pair remains the same. The pair adjusted to the moving average, but did not even work it out and can today, October 2, resume the downward movement. In the UK, the index of business activity in the construction sector with a forecast of 45.0 will be published today.
Nearest support levels:
S1 – 1.2268
S2 – 1.2207
S3 – 1.2146
Nearest resistance levels:
R1 – 1.2329
R2 – 1.2390
R3 – 1.2451
Trading recommendations:
The GBP/USD pair began an upward correction on October 1, which may already be completed. Thus, traders are advised to wait for its completion and in the case of a rebound from the moving average or a reversal of the Heiken Ashi indicator down to resume selling the pound/dollar pair with a target of 1.2207.
In addition to the technical picture, fundamental data and the time of their release should also be taken into account.
Explanation of the illustrations:
The upper channel of linear regression – the blue lines of the unidirectional movement.
The lower channel of linear regression – the purple line of the unidirectional movement.
CCI – the blue line in the indicator regression window.
The moving average (20; smoothed) – the blue line on the price chart.
Support and resistance – red horizontal lines.
Heiken Ashi – an indicator that colors bars in blue or purple.


