


Trend analysis (Fig. 1).
On Friday, the price from the level of 1.2350 (red dashed line) will move down, with the target of 1.2309 - a pullback level of 50.0% (blue dashed line).
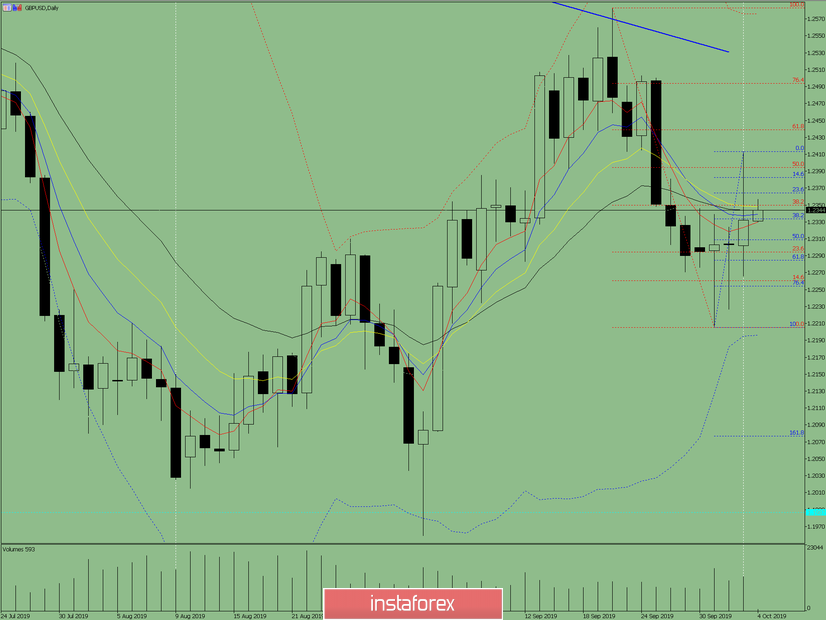
Fig. 1 (daily chart).
Comprehensive analysis:
- indicator analysis - down;
- Fibonacci levels - down;
- volumes - down;
- candlestick analysis - up;
- trend analysis - down;
- Bollinger Lines - up;
- weekly schedule - up.
General conclusion:
On Friday, before the news, the price may begin to pullback down from the level of 1.2350 (red dashed line). News can greatly influence developments.
The first lower target 1.2334 is a pullback level of 38.2% (blue dashed line).
The main target for today is 1.2309 - a pullback level of 50.0% (blue dashed line).
An unlikely scenario is an upward movement to the upper fractal - 1.2413 (blue dashed line).


