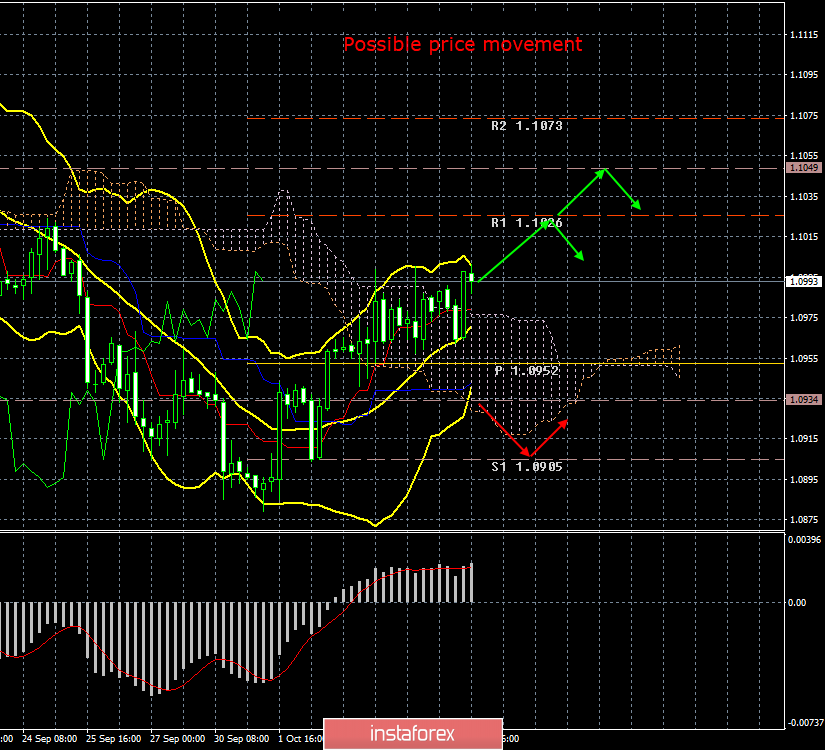
4-hour timeframe

Amplitude of the last 5 days (high-low): 63p - 64p - 60p - 58p - 43p.
Average volatility over the past 5 days: 58p (average).
The first trading day of the week was absolutely calm for the EUR/USD pair. During the day, the pair made a jerk down and then up, thus preserving a weak upward trend, and consolidated above the Ichimoku cloud, strengthening the signal to buy the "Golden Cross". However, despite the signal from Ichimoku, despite the upward trend, which has been observed for more than a week, there is still doubt that the bulls are able to begin the formation of an upward trend. Buyers of the euro remain too weak as there are few fundamental reasons for buying the euro. Even the Friday statistics, which were perceived differently by market participants, upon closer examination are, if not clearly in favor of the dollar, then not against it. Nonfarm Payrolls showed good value, although slightly below the forecast, the Nonfarm revision for the previous two months showed an increase of 45,000 non-farm jobs. The unemployment rate is the lowest for 50 years. Yes, wages in September did not increase as investors expected to see, but any indicator cannot show a constant increase in growth rates. Thus, we believe that Friday statistics from overseas can be considered positive for the US currency. So the question is: why has the US dollar not yet resumed strengthening?
It is likely that the answer to this question is very banal - a technical correction. Any pair or instrument cannot constantly move in one direction, all the same there should be corrections and kickbacks. Perhaps now is just such a moment. We have already noted more than once that traders are not too interested in topics with the possible impeachment of Donald Trump, with the US President's trade wars, and negotiations in the framework of these trade wars. They are interested in macroeconomic statistics and actions of the Federal Reserve. Both remain in favor of the US dollar. Yes, even the actions of the Fed at the last two meetings can be attributed in favor of the US currency, if we consider just the EUR/USD pair. The ECB's monetary policy is much more "dovish", despite two rate cuts from the Fed. We suggest that traders ask themselves once again: why does the Fed lower rates if macroeconomic indicators are not so bad? Afraid of the negative effects of trade wars? Amenable to constant criticism of Trump? He believes that the US president is right in his calls to soften monetary policy as quickly as possible? We believe that all together. That is, from whatever angle you look at this problem, you can still see Donald Trump. Even now, independent analytical agencies give a more than 80% chance of a key rate cut in October.
Thus, we believe that Trump will achieve his goal in the future, the key rate will be reduced to 1% at least. And then you can really expect the formation of an upward trend for the euro/dollar pair. Now the US economy remains too strong compared to the European one, and this is precisely what gives traders no reason to buy the euro.
From a technical point of view, in the coming days we can expect the strengthening of the euro to the first resistance level of 1.1026. Two speeches by Jerome Powell can strengthen or weaken the upward movement of the currency pair, as these are still important events for the currency market as a whole. However, if these statements are similar in rhetoric to Friday, then a special reaction of the Forex market can not be expected.
Trading recommendations:
The EUR/USD pair continues a weak upward movement. Thus, it is recommended to consider buying the pair while aiming for 1.1026 and 1.1049, but in small lots and with extreme caution, as the bulls remain extremely weak. It is recommended to return to the pair's sales not earlier than consolidating the price below the critical Kijun-sen line.
In addition to the technical picture, fundamental data and the time of their release should also be taken into account.
Explanation of the illustration:
Ichimoku indicator:
Tenkan-sen is the red line.
Kijun-sen is the blue line.
Senkou Span A - light brown dotted line.
Senkou Span B - light purple dashed line.
Chikou Span - green line.
Bollinger Bands Indicator:
3 yellow lines.
MACD indicator:
Red line and bar graph with white bars in the indicator window.


