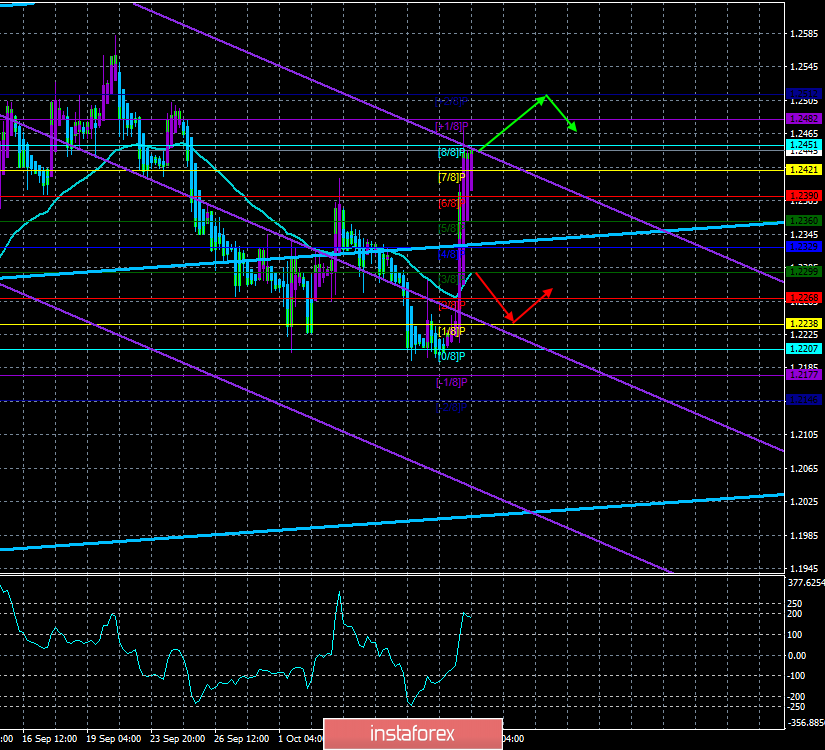
4-hour timeframe

Technical data:
The upper channel of linear regression: direction – up.
The lower channel of linear regression: direction – down.
The moving average (20; smoothed) – up.
CCI: 176.7742
Over the past day, the British pound rose by 250 points. Some traders might have thought this morning when they opened the terminal that London and Brussels had signed a "deal" overnight and would now part ways in peace, or that Boris Johnson has resigned as UK Prime Minister. However, nothing of the kind happened yesterday. So why did the pound soar?
Of the factors that are even remotely reminiscent of the reasons, we can single out the negotiations between Johnson and the Prime Minister of Ireland Leo Varadkar, during which the parties agreed to continue negotiations further. Both sides have traditionally noted "progress in negotiations", and, in fact, everything. Of course, the issues addressed concerned the Northern Irish border and the life of both countries on the island of Ireland after the "divorce" of the Kingdom and the Alliance. Is it this information that somehow caused traders to actively buy the pound? Because nothing else happened last night either in the UK or in the States. "Successful" – current status of the negotiations with China according to Trump? Why then did the euro currency not react to this "luck" at all? In general, it is impossible to say now exactly what led to the rise of the pound. There may be a whole set of factors, some of which may not be visible to ordinary traders. Technical reasons, the actions of major players in the foreign exchange market, rumors, insider information – all this could lead to a sharp increase in the British currency. We recommend considering the current situation from a slightly different perspective. If the rise was not a trivial accident, then there are reasons. Since the pound has risen in price, is this perhaps a good signal for Brexit? If so, in the next few days, the pound will hold on to the positions won from the dollar. If there are no positive signals, then the fall of the pound/dollar pair may resume today.
The calendar of macroeconomic events in the UK is empty today, and information about consumer confidence, which cannot be called super important even potentially, will come from across the ocean. After such a sharp increase in the pair, we expect a downward correction, and in the coming days, traders and experts will need to find out what were the true reasons for the strengthening of the British currency. If they simply do not exist, then very soon we may witness a resumption of the downward trend. There are no visible reasons for such a strong growth of the pair, as we have already said.
Nearest support levels:
S1 – 1.2421
S2 – 1.2390
S3 – 1.2360
Nearest resistance levels:
R1 – 1.2451
R2 – 1.2482
R3 – 1.2512
Trading recommendations:
The GBP/USD pair is likely to begin to adjust after yesterday's growth. In any case, without a visible fundamental background and after strengthening by 250 points, it is dangerous to buy the pound. Thus, it is recommended to wait for the market situation to calm down, and sales can be returned after fixing the bears below the moving average.
In addition to the technical picture, fundamental data and the time of their release should also be taken into account.
Explanation of the illustrations:
The upper channel of linear regression – the blue lines of the unidirectional movement.
The lower channel of linear regression – the purple lines of the unidirectional movement.
CCI – the blue line in the regression window of the indicator.
The moving average (20; smoothed) – blue line on the price chart.
Murray levels – multi-colored horizontal stripes.
Heiken Ashi – an indicator that colors bars in blue or purple.


