


Trend analysis.
This week, the price will continue to move up with the target of rolling back the level of 61.8% – 1.1208 (blue dotted line). Breaking through this level is unlikely, and the market from this level will try to start moving down into a pullback, with the first target of 1.1131 – a pullback level of 23.6% (red dotted line).
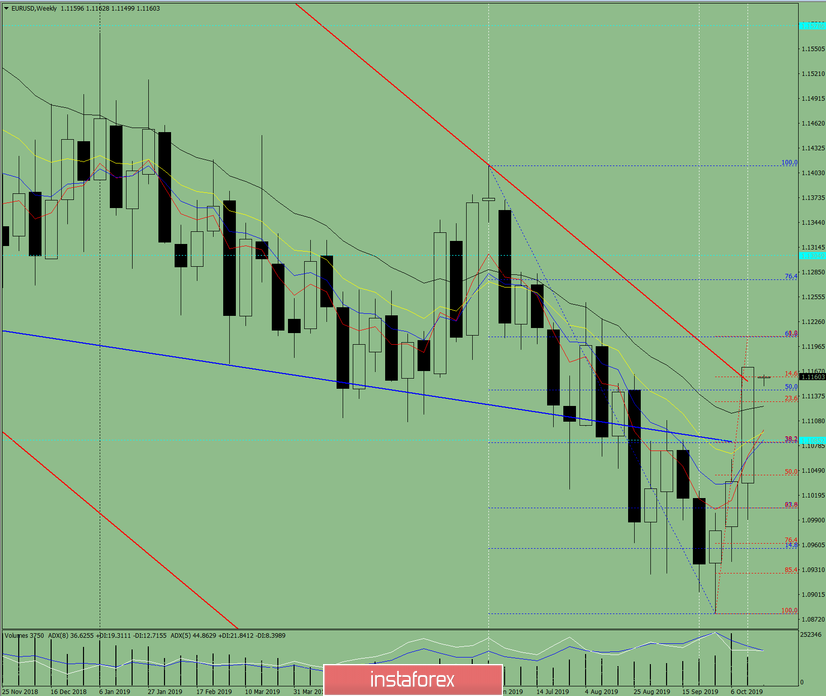
Fig. 1 (weekly chart).
Complex analysis:
- Indicator analysis – up;
- Fibonacci levels – up;
- Volumes – down;
- Candlestick analysis – down;
- Trend analysis – up;
- Bollinger Bands – up;
- Monthly chart – up.
The conclusion of the complex analysis – an upward movement.
The total result of calculating the candle of the EUR/USD currency pair according to the weekly chart: the price for weeks will most likely have an upward trend with the absence of the first lower shadow of the weekly white candlestick (Monday – up) and the absence of the second upper shadow (Friday – up).
The first upper target of 1.1208 is a pullback level of 61.8% (blue dotted line).
From this level, it is possible to move down with the target of 1.1131 – a pullback level of 23.6% (red dotted line).


