


Trend analysis (Fig. 1).
On Wednesday, the price may continue to move down again to a pullback level of 23.6% - 1.2820 (blue dashed line). From this level, it is possible to continue moving down to the pullback level of 38.2% - 1.2700 (blue dashed line).
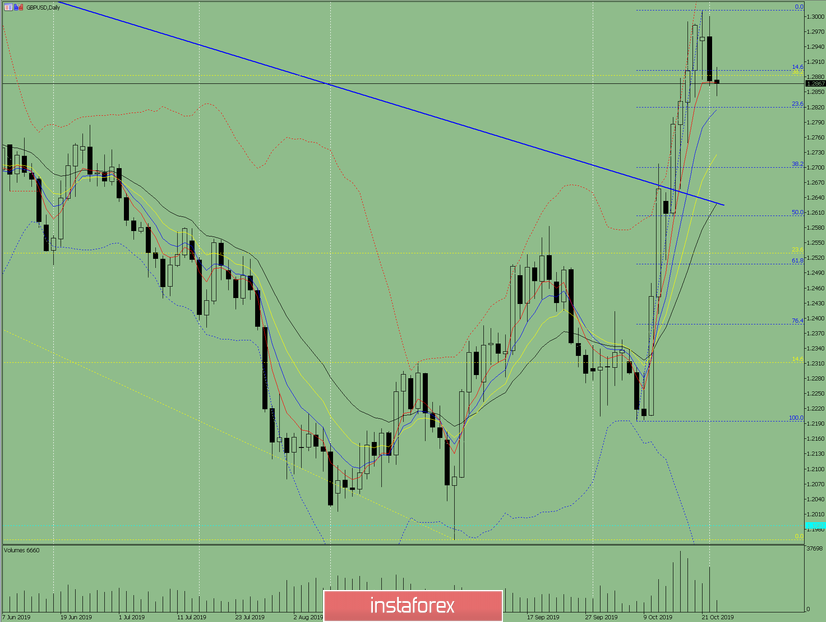
Fig. 1 (daily chart).
Comprehensive analysis:
- indicator analysis - down;
- Fibonacci levels - down;
- volumes - down;
- candlestick analysis - down;
- trend analysis - up;
- Bollinger Lines - down;
- weekly schedule - up.
General conclusion:
On Wednesday, the price may continue to move down.
The first lower target is the pullback level of 23.6% - 1.2824 (blue dashed line). In case of breakdown of this level, the continuation of the downward movement with the target of 1.2700 which is the pullback level of 38.2% (blue dashed line), is possible.
An unlikely scenario is to work up to the upper fractal of 1.3013 (blue dashed line).


