


Trend analysis.
This week, the price will move up with a target of 1.121 – resistance line (red bold line). Breaking this level up will depend on the strong news that comes out on Wednesday (US interest rates) and the market will most likely try to move up from the level of 1.1077, with the first goal of 1.1179 – the upper fractal (red dotted line).
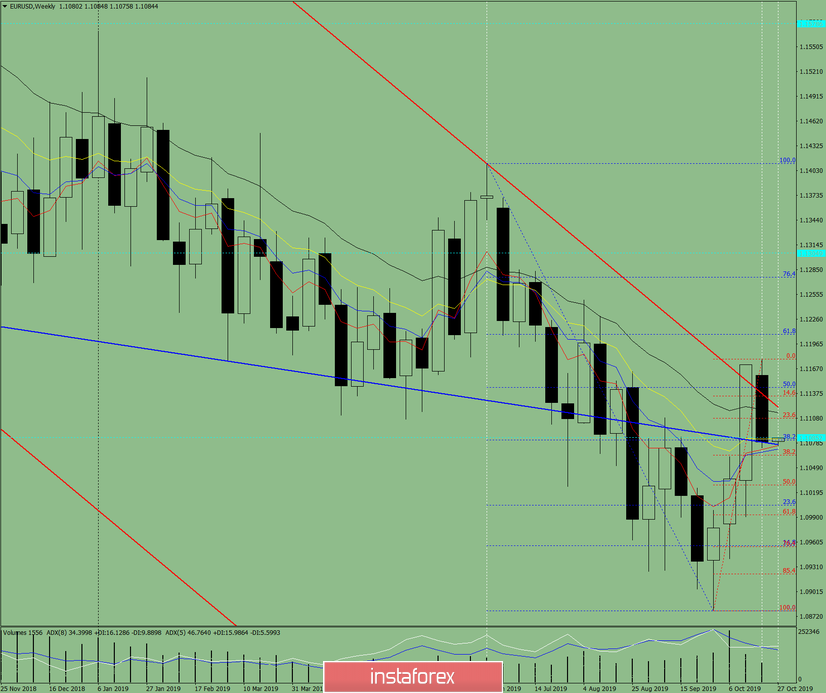
Fig. 1 (weekly chart).
Complex analysis:
- Indicator analysis – up;
- Fibonacci levels – up;
- Volumes – up;
- Candlestick analysis – down;
- Trend analysis – up;
- Bollinger bands – up;
- Monthly chart – up.
The conclusion of the complex analysis – an upward movement.
The overall result of calculating the candle of the EUR/USD currency pair according to the weekly chart: the price of the week is likely to have an upward trend (up to US interest rates) with the absence of the first lower shadow of the weekly white candlestick (Monday – up) and the absence of the second upper shadow (Friday – up).
The first upper target of 1.1121 is the resistance line (red bold line).
From this level, it is possible to continue the upward movement with the goal of 1.1179 – the upper fractal (red dotted line).
A possible news scenario is a downward movement with a target of 1.1063 – a pullback level of 38.2% (red dotted line).


