


4-hour timeframe
Amplitude of the last 5 days (high-low): 34p - 70p - 50p - 31p - 46p.
Average volatility over the past 5 days: 46p (average).
The third trading day of the week for the EUR/USD currency pair is held in the same calm trading as the first two. There is no trend movement as such. The euro/dollar is moving quietly along the Kijun-sen critical line, which is the best evidence of an open flat, both in terms of short-term perspective and intraday plan. Thus, since all the macroeconomic publications of the day are already behind us, traders can only wait for the results of the meeting of the Federal Reserve and hope that the market wakes up, and Jerome Powell will tell something important to his listeners. If, however, no concrete hints of the Fed's future actions follow, then all of today with very loud signs of fundamental events could end in complete disappointment. By the way, volatility remains at the "average" level, which borders on the definition of "low".
It all began today, not with American news, but with German. In Germany, a not very significant unemployment rate was published, which amounted to 5% (full compliance with the previous value and the forecast). A little later, the consumer price index for Germany for October was released (preliminary value), which fell to 1.1% YOY, as experts predicted. This means that the final value for the month may also slow down, and a little later it will become known about the slowdown of pan-European inflation. Around the same time, data from overseas began to be published, which, however, also did not have a high degree of significance, especially amid the evening events. The annual data on US GDP unexpectedly amounted to +1.9% in the third quarter with forecasts of only +1.6%, the index of expenses for personal consumption increased compared to the previous period and amounted to +2.2% YOY, and a report on the change in the number of employees in the private sector from ADP showed an increase of 125,000 new workers (with a forecast of +120K). Thus, all macroeconomic data from the United States turned out to be better than what traders expected ... and this does not matter, at least in the context of today. There was no reaction to these statistics, since the markets are clearly waiting for the Fed's evening meeting. The Fed itself has already made a decision on monetary policy, it remains only to voice it. Jerome Powell will also make a speech, most likely, without taking into account the latest publications. Thus, nothing has changed.
Traders can only guess what decision the Fed's monetary committee will make and what Jerome Powell will say at the press conference. As Powell prepares for his evening speech, US President Donald Trump has already entered the stage, with recent speeches that frame every Fed meeting. Trump speaks before the meeting, after the meeting, in between meetings, writes angry tweets on the social network, and all this focuses on only one topic and contains only one message: "The Fed lowers rates too slowly. The cost of borrowing, thanks to Powell, remains very high. The states cannot fully realize their huge potential due to high rates and an expensive dollar. " This was repeatedly stated by the US president, but often his insinuations are much more laconic - this is a simple criticism of the Fed and personally Jerome Powell.
We have repeatedly said that the Fed's monetary policy is of great importance for Trump, since the outcome of a trade war with China and a trade deal that can be concluded between countries depend on it. The more influence Trump can have on monetary policy, the more advantages he will have in his hands in negotiations with China, the more maneuverability he can show in a dialogue with Beijing. But for now, the trump cards are in Beijing's hands, which is subject to the central bank of China, unlike the Fed and Trump. Thus, Trump acts according to the only scenario possible under conditions of impossibility of influence on the Federal Reserve. He constantly criticizes the Fed, blames the regulator for all the troubles and failures, and this ... leads to success. Today, the Fed may lower the rate for the third time in a row.
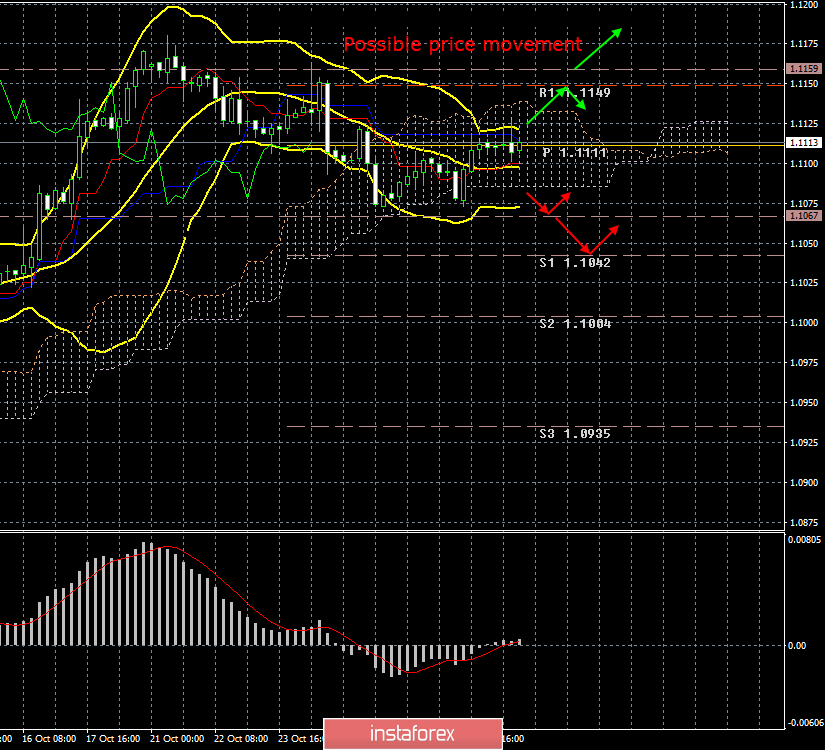
From a technical point of view, there is absolutely nothing to say now, since the market is completely calm and flat. Most of the traders are out of the market, hiding and even during the evening summing up the results of the Regulator's meeting can remain "on the fence". In addition, the euro/dollar is located inside the Ichimoku cloud, which once again signals the absence of trend movement. Moreover, in order to announce the resumption of trend movement, you need to wait until the price consolidates above the Kijun-sen line or overcome the lower boundary of the Ichimoku cloud. In both the first and second cases, the pair will immediately run into other support/resistance levels, which again makes it difficult to develop a new trend.
Trading recommendations:
EUR/USD continues to adjust, being inside the Ichimoku cloud. Slowly you can take a closer look at euro sales, especially if the bears manage to gain a foothold below the Ichimoku cloud. However, tonight, we recommend that it be wary of opening any positions, since the results of the Fed meeting and the press conference of its chairman may bring surprises, but may not affect the course of trading at all.
Explanation of the illustration:
Ichimoku indicator:
Tenkan-sen is the red line.
Kijun-sen is the blue line.
Senkou Span A - light brown dotted line.
Senkou Span B - light purple dashed line.
Chikou Span - green line.
Bollinger Bands Indicator:
3 yellow lines.
MACD indicator:
Red line and bar graph with white bars in the indicator window.
Support / Resistance Classic Levels:
Red and gray dotted lines with price symbols.
Pivot Level:
Yellow solid line.
Volatility Support / Resistance Levels:
Gray dotted lines without price designations.
Possible price movements:
Red and green arrows.


