


Trend analysis (Fig. 1).
On Tuesday, the price from the pullback level of 14.6% - 1.2859 (blue dashed line) can start to move up with the first target 1.2976 - the upper fractal. In case of breaking through this level, the continuation of the upward movement to the next upper fractal is 1.3013 (blue dashed line).
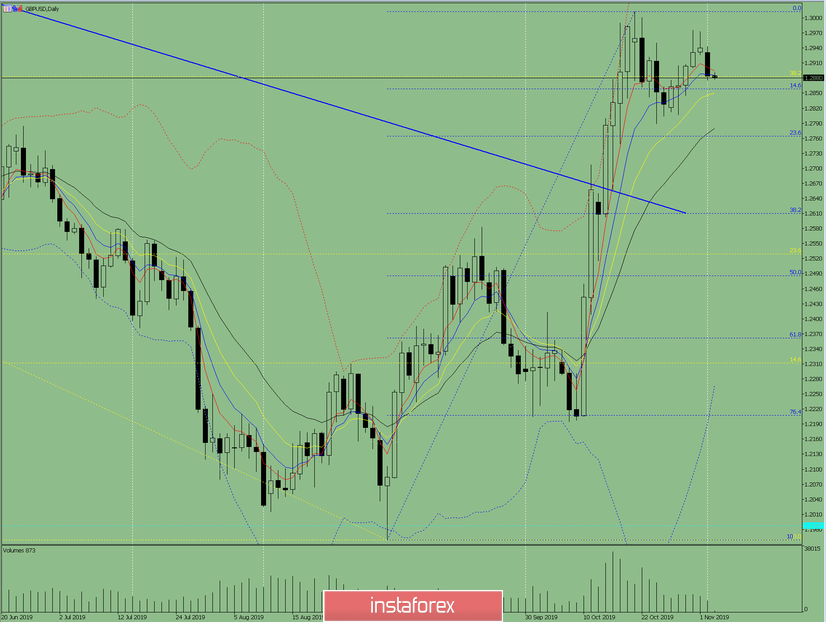
Fig. 1 (daily chart).
Comprehensive analysis:
- Indicator analysis - down;
- Fibonacci levels - down;
- Volumes - up;
- Candlestick analysis - down;
- Trend analysis - up;
- Bollinger Lines - up;
- Weekly schedule - up.
General conclusion:
On Tuesday, the price may start to move up.
The first lower target of 1.2859 is a retracement level of 14.6% (blue dashed line). From this level, the upward movement with the first target of 1.2976 is the upper fractal. In case of breaking through this level, the continuation of the upward movement to the next upper fractal is 1.3013 (blue dashed line).
An unlikely scenario: from a pullback level of 14.6% - 1.2859 (blue dashed line), a downward movement with the first target 1.2789 is a lower fractal.


