


Hello!
In this article, we will consider the technical picture of one of the main and quite interesting currency pairs – USD/JPY.
The US dollar firmly occupies a leading position as the world's reserve currency, in which the lion's share of payments for goods and services is conducted between countries. However, recently, states such as Russia, China, and some others are considering options for mutual settlements in their national currencies.
In many ways, this is the "merit" of the 45th US President Donald Trump, who continues to break many of the world's political and economic foundations.
As for the Japanese currency, it is traditionally considered one of the most popular protective assets (safe haven currency) and is very often in high demand among investors.
Before proceeding to the analysis of the technical picture of USD/JPY, I would like to note that this currency pair is very sensitive to important macroeconomic statistics from the United States, which is not surprising, given the leading role of the US economy in the world.
Weekly
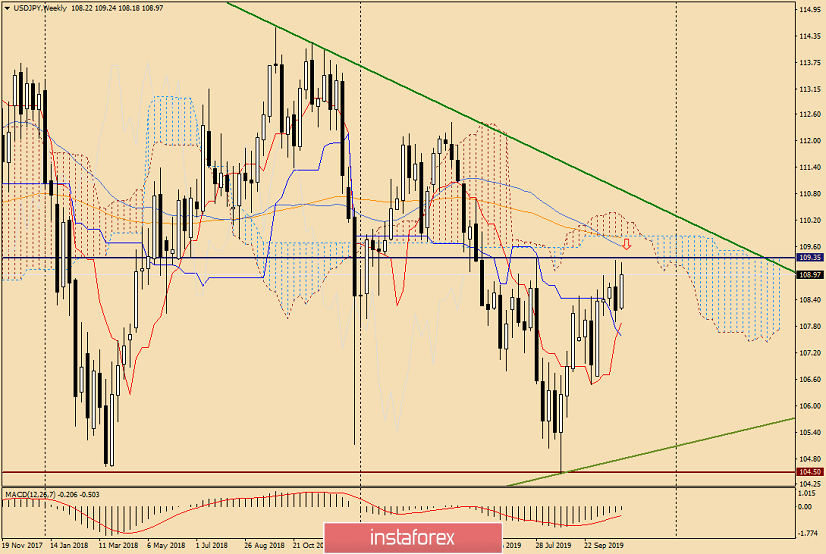
On the weekly chart, the pair rose to a strong and significant resistance level, which is located at 109.35. Taking into account that 55 MA and 144 EMA are located a little higher, it will be very difficult to go up the price zone of 109.30-109.60.
Also, the lower limit of the Ichimoku indicator cloud passes at 109.84, and the psychological level of 110 yen per dollar is even higher.
It is also worth considering that near 110.70 lies the green resistance line of 125.30-114.20. I note that this line is long-term, and only its true breakdown will indicate the bullish sentiment of market participants.
Thus, taking into account the above-mentioned factors, the price zones of 109.30-109.60, as well as 110.10-110.70 can be considered as guidelines for sales.
Judging by the weekly chart, you can look at the purchases after the pair's decline to the area of 108.00-107.50, where the Tenkan and Kijun lines of the Ichimoku indicator are located.
It has long been noted that these lines often have a strong influence on the price and often turn it around, so their position on the charts must be taken into account. According to the results of long tests and observations, I use the Ichimoku indicator on the weekly and daily timeframes. There are stronger signals and fewer false positives.
Daily
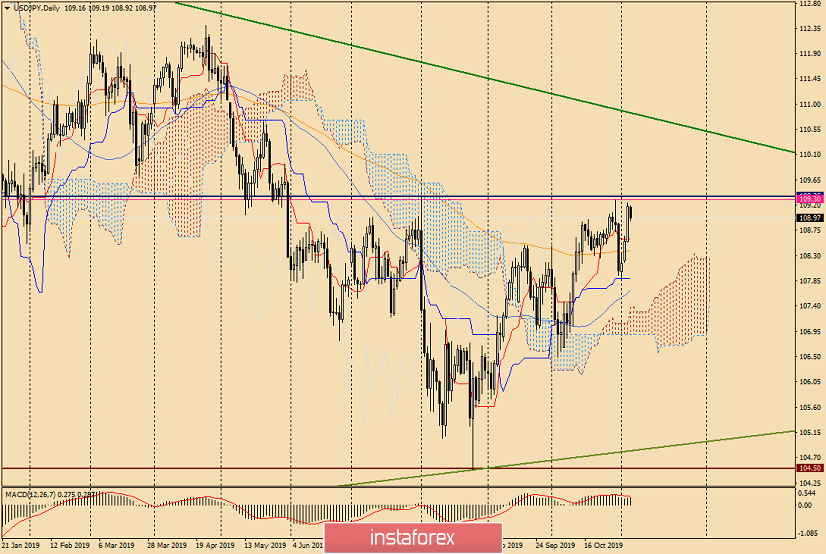
This timeframe confirms the presence of the resistance zone of 109.30-109.35, which is quite strong and difficult to overcome for players to increase the rate.
Please note that the pair fell short of the highs of 109.32 on August 1 this year, and having reached the maximum values of 109.29 on October 30, it bounced down. At the time of writing, USD/JPY is trading slightly lower.
Most often, such situations indicate a change of rate, but do not rush. In my opinion, it is better to wait for what price will end today's trading and what will be the candle.
The fact is that today they opened 1 point below yesterday's close. In the case of a bearish candle, approximately in the form in which it looks now, a reversal model of the Harami candlestick analysis will appear. The essence of this model is that the body of today's last candle (by Harami itself) is inside the previous one.
This pattern is quite often and well-practiced. A better chance of working out appears when Harami is formed under strong levels or zones of resistance, as in this case.
In general, in my opinion, sales are the most interesting at the moment, the confirmation for the opening of which will be the formation of a reversal candlestick model "Harami". If this happens, I recommend considering the opening of short positions after the rise in the price zone of 109.10-109.30.
The prices listed in the description of the weekly timeframe can also be used to open trades, but most likely it will not be today or tomorrow.
Good luck and big profits!


