


To open long positions on EURUSD, you need:
Despite weak data on German industrial production, which declined in September this year, the euro managed to rebound from the week's low of 1.1055, preventing sellers from even holding the pair to the support of 1.1050. At the moment, the return to the resistance level of 1.1075 keeps buyers of the European currency in the market, which will seek to update the maximum of 1.1100, where I recommend fixing the profits. If the pressure on the euro returns in the afternoon and the pair falls below the support of 1.1075, it is best to count on new purchases after updating the minimum of 1.1050 or open long positions immediately on the rebound from the area of 1.1026. Data on the US labor market and consumer lending may support the dollar.
To open short positions on EURUSD, you need:
Sellers failed to break below the support of 1.1050, which limits the downward potential. The absence of important fundamental statistics for the US, except for the weekly report on the US labor market, may keep the demand for EUR/USD in the afternoon. The continuation of the upward correction will lead to an update of the resistance of 1.1100, from which the euro can be sold only if a false breakdown is formed there. I recommend to open short positions immediately on the rebound only after the test of the maximum of 1.123. The main task of the bears in the North American session will be the return of the euro below the support of 1.1075, which will increase the pressure on the pair and will update weekly low near 1.1050, where I recommend taking the profit.
Indicator signals:
Moving Averages
Trading is conducted in the area of 30 and 50 moving averages, which indicates the likely end of the downward trend in the pair.
Bollinger Bands
Growth may resume if the upper limit of the indicator breaks in the area of 1.1090. In the case of a decline in the pair, the lower border of the indicator around 1.1052 will provide support.
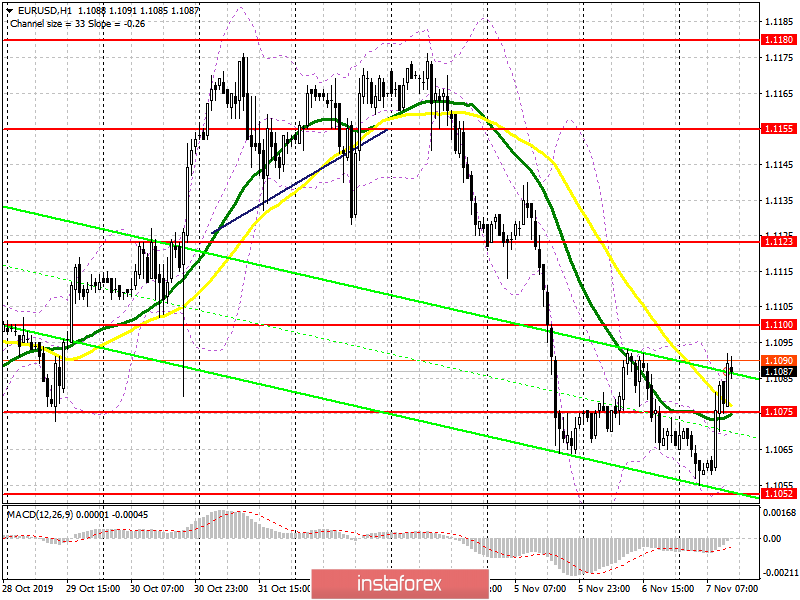
Description of indicators
- MA (moving average) 50 days – yellow
- MA (moving average) 30 days – green
- MACD: fast EMA 12, slow EMA 26, SMA 9
- Bollinger Bands 20


