


The pair moved up on Monday, tested the pullback level of 50% - 1.2891 (red dashed line), but the bulls could not gain a foothold above this level, and the price dropped to 1.2853. Today it is possible to continue the upward movement. On Tuesday, strong calendar news is expected at 09.30 Moscow time (pound).
Trend analysis (Fig. 1).
On Tuesday, the price from the retracement level of 38.2% - 1.2862 (red dotted line) can continue to move up with the first target 1.2898 - the upper fractal. In case of breaking through this level, the continuation of upward movement to a retreating level of 61.8% - 1.2919 (red dotted line).
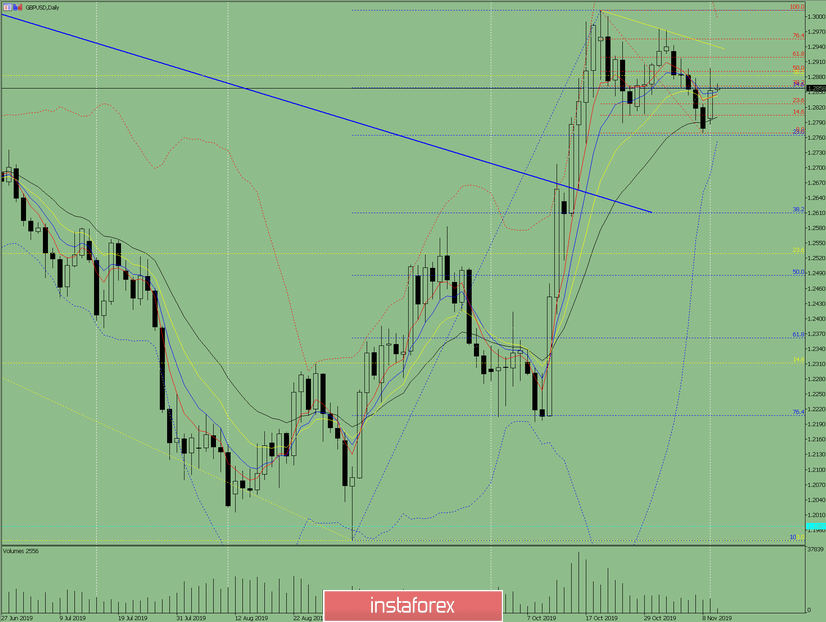
Fig. 1 (daily chart).
Comprehensive analysis:
- Indicator analysis - down;
- Fibonacci levels - down;
- Volumes - down;
- Candlestick analysis - up;
- Trend analysis - up;
- Bollinger Lines - up;
- Weekly schedule - up.
General conclusion:
On Tuesday, the price may continue to move up with the first target 1.2898 - the upper fractal. In case of breaking through this level, the continuation of upward movement to a retreating level of 61.8% - 1.2919 (red dotted line).
An unlikely scenario: from a pullback level of 38.2% - 1.2859 (red dotted line), the downward movement with the first target 1.2769 is the lower fractal.


