


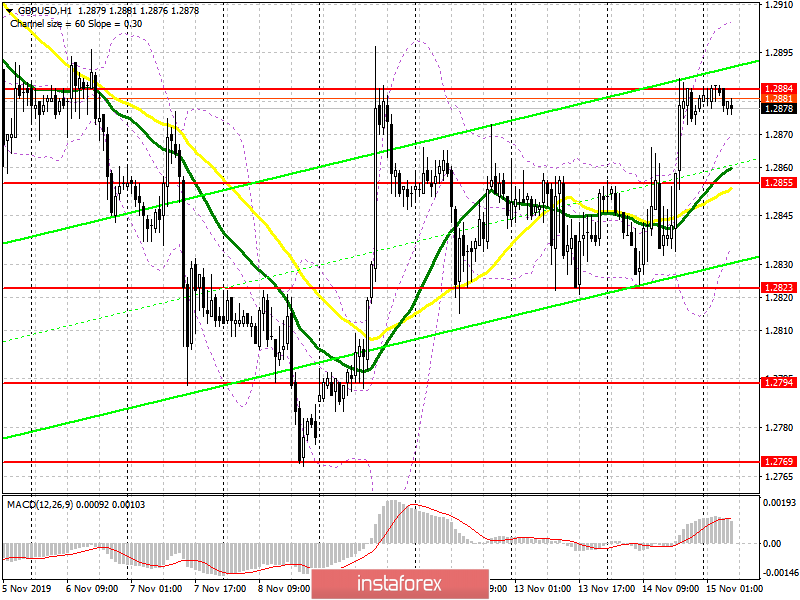
To open long positions on GBP/USD you need:
Yesterday's weak data on a decline in UK retail sales did not allow the formation of a new major downward trend. Market participants continue to focus on elections in the UK and are more likely to respond only to this information. The primary task of the bulls today will be to keep the pair above the level of 1.2855, the formation of which a false breakout will be a signal to buy the pound. However, a more important goal is to break through and consolidate above the resistance of 1.2884, which will lead to a new upward impulse to the area of highs 1.2910 and 1.2938, where I recommend profit taking. In the scenario of a breakthrough of support at 1.2855, you can immediately buy the pound for a rebound from the lower boundary of the side channel in the area of 1.2823.
To open short positions on GBP/USD you need:
Pound sellers will try their best to prevent the breakdown of resistance at 1.2884, and the formation of a false breakout there in the afternoon is a signal to sell GBP/USD in order to pull down 1.2855 towards the middle of the side channel and update its lower boundary in the area of 1.2823, where I recommend profit taking. However, a larger downward movement can be expected only after the release of a good report on US retail sales. With the GBP/USD growth scenario above the resistance of 1.2884, one can consider new short positions from the resistance of 1.2910, or immediately sell for a rebound from the high of 1.2938.
Signals of indicators:
Moving averages
Trade is conducted above 30 and 50 moving averages, which indicates the pound's continued growth in the short term.
Bollinger bands
The upward movement will be limited by the upper indicator level at 1.2905, from where it is possible to open short positions immediately for a rebound. In case the pound falls, support will be provided by the lower boundary of the indicator in the area of 1.2840, where today you can see the pound being bought based on the formation of a false breakout in the area of 1.2855.
Description of indicators
- MA (moving average) 50 days - yellow
- MA (moving average) 30 days - green
- MACD: Fast EMA 12, Slow EMA 26, SMA 9
- Bollinger Bands 20


