


4-hour timeframe
Technical data:
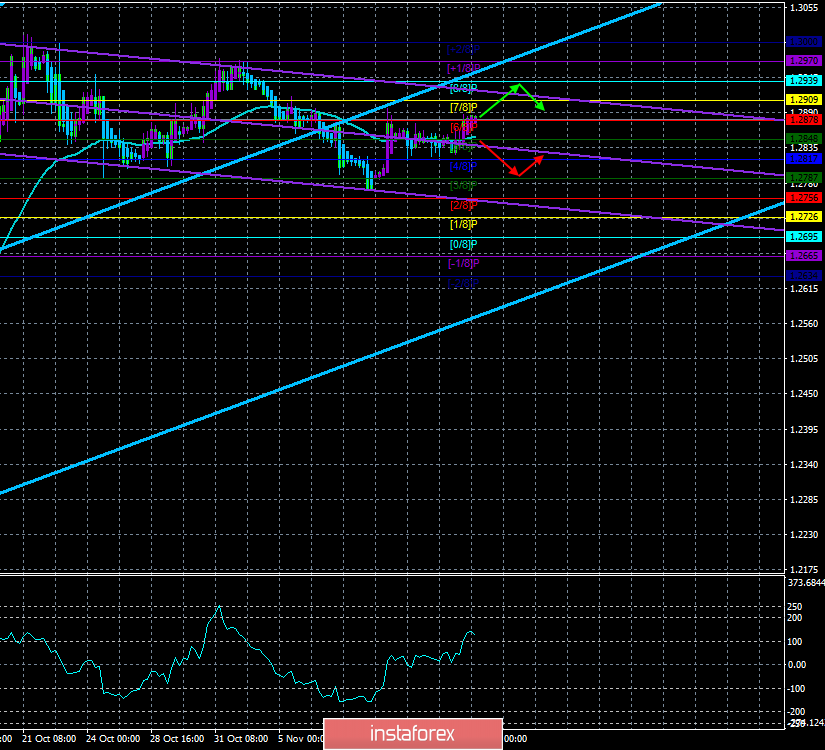
The upper channel of linear regression: direction – up.
The lower channel of linear regression: direction – down.
The moving average (20; smoothed) – sideways.
CCI: 123.4221
The British pound paired with the US dollar yesterday at the US trading session also made a small jump up, however, as in the case of the EUR/USD pair, the efforts of the bulls very quickly came to "no", as there were no special reasons for the fall of the US currency. The British currency once again with great pleasure ignored the failed reports from the UK, which allows it to stay afloat, and not to collapse like a stone to the bottom. Only this week, any macroeconomic report from the UK could send the pound far down. However, traders, instead of trading off a strong fundamental background, continue to wait for news on the election and Brexit. Since neither of these is currently available, the volatility of the GBP/USD pair is also quite low, and there is no trend movement as such.
No macroeconomic data is expected from the UK on the last trading day of the week. Thus, today's flat on the pair, if, of course, it persists, will already be fully justified. It is unlikely that after three weeks of relative calm, traders will get excited because of not the most significant report on retail sales in the United States. Thus, the prospects for the movement of the British pound, from our point of view, remain unambiguously downward. There are a number of reasons for this: an imbalance in favor of the dollar between the monetary policies of the Bank of England and the Fed, the unresolved Brexit, the rapidly deteriorating macroeconomic statistics in the UK, outright political crisis in the Kingdom, the likely completion of the period of weak economic reports in the US, a high probability of reducing the key rate of the British regulator in the near future. If all this is multiplied by global uncertainty, in which both the British pound and the whole Great Britain have been floating over the past three years, it becomes clear that the British currency has only one way – down. The only thing to note is that everything still depends on market participants and will always depend. Whatever the macroeconomic data and the fundamental background, if investors and traders do not want to sell the pound, it will not get cheaper. At this time, they don't want to. Therefore, the British currency, despite the failed data is still afloat and does not go to the bottom.
However, the main question is, how long will it last? How much longer will traders persist in ignoring deteriorating GDP, slowing inflation, low retail sales, and wage growth? Until December 12? In this case, all participants of the forex market can calm down for exactly a month. We could recommend market participants in this situation to pay attention to technical factors, but in the conditions of absolute flat, which has been observed in recent days, even the technique says nothing about the prospects for the movement of the pound/dollar currency pair. So we can only wait for the flat to end, for the Brexit mess to end, for the UK parliamentary elections to take place, for traders to remember that it is economic statistics that matter most to any economy.
Nearest support levels:
S1 – 1.2848
S2 – 1.2817
S3 – 1.2787
Nearest resistance levels:
R1 – 1.2878
R2 – 1.2909
R3 – 1.2939
Trading recommendations:
The GBP/USD currency pair continues to trade near the moving average line, so we do not recommend traders to open any positions now. To have the opportunity to trade, you need to wait until the quotes of the pound/dollar pair "detach" from the moving average, and the flat is completed. Considering that traders are practically not responding to fundamental data, the flat can last from several days to several weeks. For such a scenario, you must also be prepared.
In addition to the technical picture, fundamental data and the time of their release should also be taken into account.
Explanation of the illustrations:
The senior channel of linear regression – the blue lines of the unidirectional movement.
The lower channel of linear regression– the purple line of the unidirectional movement.
CCI – the blue line in the regression window of the indicator.
The moving average (20; smoothed) – the blue line on the price chart.
Support and resistance – the red horizontal lines.
Heiken Ashi – an indicator that colors bars in blue or purple.
Possible variants of the price movement:
Red and green arrows.


