To open long positions on GBP/USD, you need:
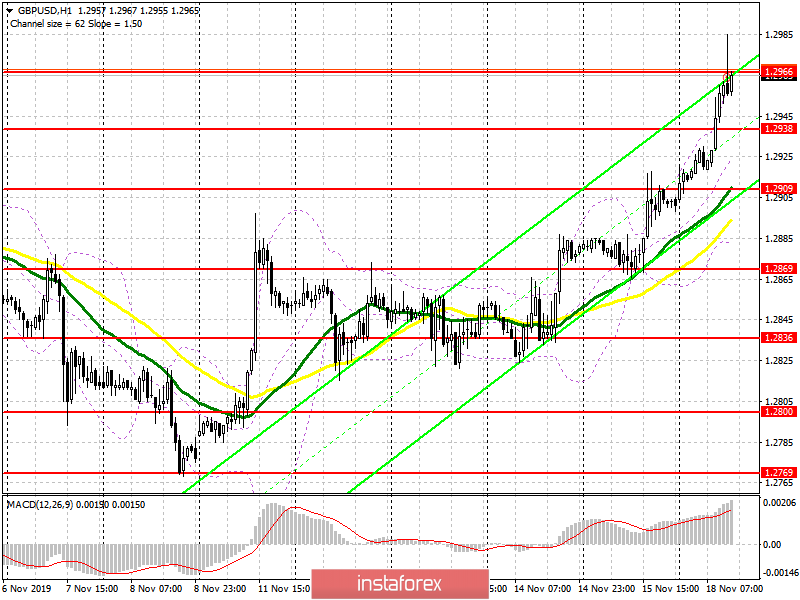
The British pound managed to strengthen its position on Monday morning after the news that all candidates from the Conservative Party of the UK will support the Brexit agreement proposed by Prime Minister Boris Johnson. This was stated by the Prime Minister himself. Rising expectations that Johnson will be able to win the general election provides support to the pound. At the moment, the bulls are focused on the resistance of 1.2966, to break above which the first time failed. Consolidation at this level in the second half of the day will lead to the continuation of the upward trend formed from November 7, which will allow us to reach the highs around 1.3017 and 1.3074, where I recommend taking the profits. In a downward correction, it is best to count on buying the pound only after the formation of a false breakdown in the support area of 1.2938 or buy immediately for a rebound from the minimum of 1.2909.
To open short positions on GBP/USD, you need:
Sellers coped with the task for the first half of the day and did not let the pound above the resistance of 1.2966, which I paid attention to in my morning review. The formation of a false breakdown in the area of 1.2966 still retains the option of a downward correction with a return to the support of 1.2938. However, the more important task will be to consolidate below this range, which will push GBP/USD to the lows of 1.2909 and 1.2869, where I recommend taking the profits. If the growth of the pair leads to a breakdown of the resistance of 1.2966, then in this scenario, it is best to consider short positions after updating the maximum of 1.3017 and sell the pound immediately on a rebound from 1.3074.
Indicator signals:
Moving Averages
Trading is above the 30 and 50 daily averages, which indicates a further upward correction of the pound.
Bollinger Bands
If the pair decreases, support will be provided by the average border of the indicator around 1.2925, and you can buy immediately for a rebound after testing the lower border in the area of 1.2885.

Description of indicators
- MA (moving average) 50 days – yellow
- MA (moving average) 30 days – green
- MACD: fast EMA 12, slow EMA 26, SMA 9
- Bollinger Bands 20


