


The pair on Tuesday, moving up, re-tested the resistance line 1.1085 (red bold line). There is also a retracement level of 50% - 1.1086 (blue dashed line). So to overcome this cloud, which consists of two obstacles, the price from the first try will be difficult. On Wednesday, strong calendar news is expected at 15.30 and 19.00 Universal time (dollar). Today, the market may begin to roll back down.
Trend analysis (Fig. 1).
On Wednesday, the price will move down into a pullback with the first target of 1.1052 - a pullback level of 38.2% (red dashed line). In case of breaking through this level, the continuation of work down with the target 1.1040 is a pullback level of 50.0% (red dashed line).
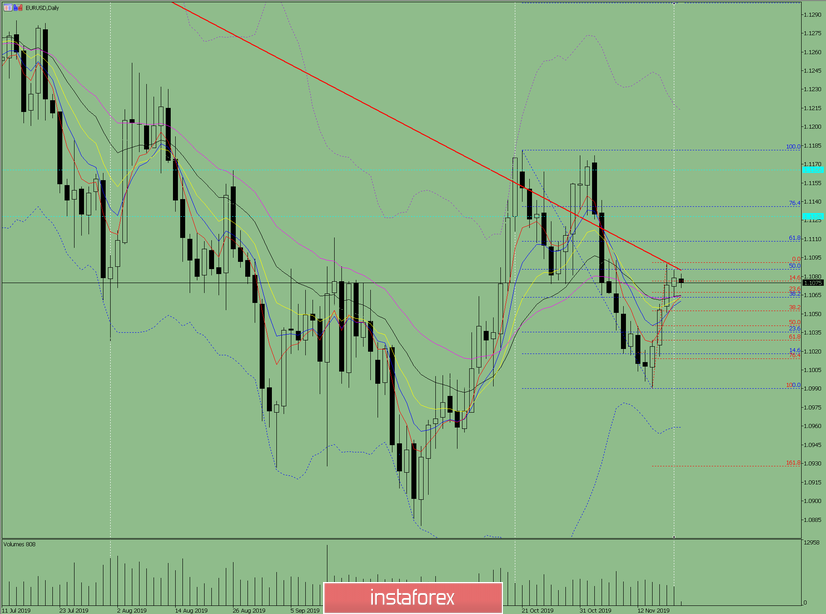
Fig. 1 (daily chart).
Comprehensive analysis:
- Indicator analysis - down;
- Fibonacci levels - down;
- Volumes - down;
- Candlestick analysis - down;
- Trend analysis - down;
- Bollinger Lines - up;
- Weekly schedule - up.
General conclusion:
On Wednesday, a pullback downward movement is possible.
The first lower target 1.1052 is the retracement level of 38.2% (red dashed line). In case of breaking through this level, the continuation of work down with the target 1.1040 is a pullback level of 50.0% (red dashed line).
An unlikely upper scenario is an attempt to once again break the resistance line 1.1084 and go up with the target 1.1091 - the upper fractal (red dashed line).


