


To open long positions on GBP/USD, you need:
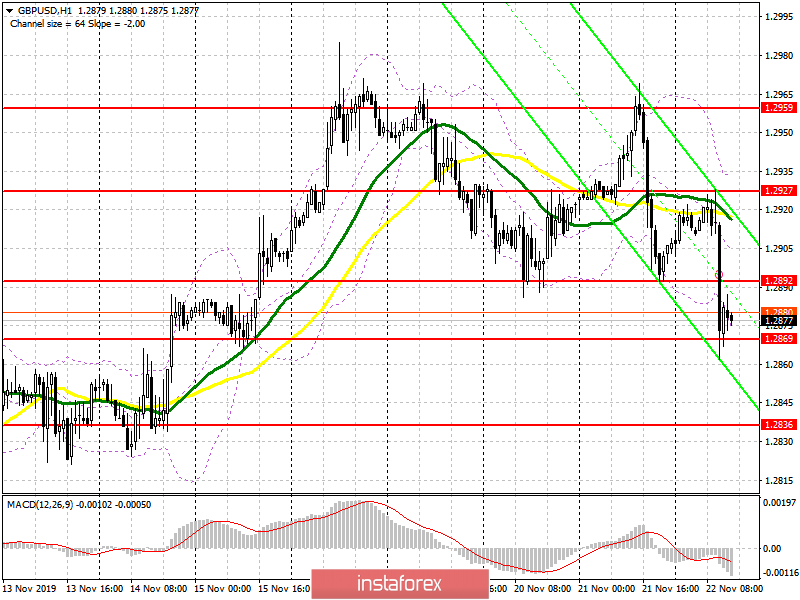
Weak data on activity in the UK services sector, which continued to decline, led to another fall of the British pound in the area of the support level of 1.2869, which I drew attention to in my morning survey. At the moment, the bulls are holding the pair above 1.2869, but there are no active purchases in this range. Most likely, the focus will be shifted to a similar report on the US composite index. Weak data will lead to the formation of a false breakdown in the area of 1.2869 and the recovery of the pound in the area of resistance of 1.2892, and it is quite possible to return to the area of the maximum of 1.2927, where I recommend taking the profits. In a different scenario, a breakout of 1.2869 will collapse GBP/USD even lower to the support area of 1.2836, from where you can watch long positions immediately rebound.
To open short positions on GBP/USD, you need:
Sellers coped with the task for the first half of the day and broke through the support of 1.2892, which I paid attention to in the morning forecast. At the moment, the focus is on the level of 1.2869, the breakthrough of which will lead to a larger sell-off of GBP/USD with a test of the lows of 1.2836 and 1.2800, where I recommend taking the profits. In the scenario of the pair growth and upward correction in the second half of the day, you can consider new sales on a false breakdown from the resistance of 1.2892, and open short positions immediately on the rebound is best from the maximum of 1.2927.
Indicator signals:
Moving Averages
Trading is conducted below the 30 and 50 daily averages, which indicates the further formation of a downward correction in the pair.
Bollinger Bands
In the scenario of the pound growth, the average border of the indicator around 1.2905 will act as a resistance, from which you can see short positions.
Description of indicators
- Moving average (moving average determines the current trend by smoothing volatility and noise). Period 50. The chart is marked in yellow.
- Moving average (moving average determines the current trend by smoothing volatility and noise). Period 30. The chart is marked in green.
- MACD indicator (Moving Average Convergence/Divergence - convergence/divergence of moving averages) - EMA period 12. Slow EMA period to 26. SMA period 9
- Bollinger Bands (Bollinger Bands). Period 20


