


Trend analysis (Fig. 1).
On Monday, the price, moving up, will test the retracement level of 38.2% - 1.2883 (yellow dashed line). After reaching this level, working down with a lower target of 1.2823 is a lower fractal.
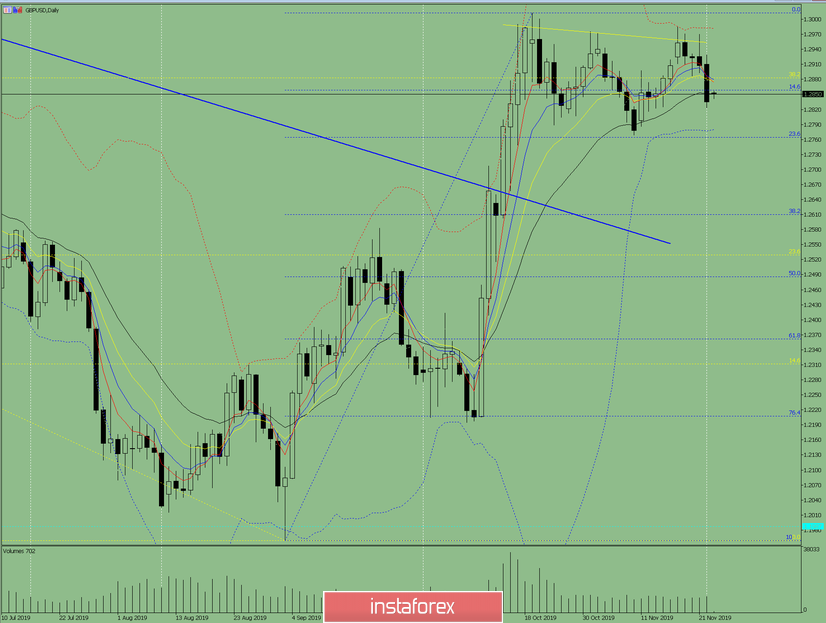
Fig. 1 (daily chart).
Comprehensive analysis:
- Indicator analysis - up;
- Fibonacci levels - up;
- Volumes - down;
- Candlestick analysis - up;
- Trend analysis - down;
- Bollinger Lines - down;
- Weekly schedule - down.
General conclusion:
On Monday, the price may start a pullback on upward movement.
The price, moving up, will test the retracement level of 38.2% - 1.2883 (yellow dashed line). If this level is reached, working down with a lower target of 1.2823 is a lower fractal.
An unlikely scenario is to immediately go down with the target at 1.2764 - the lower fractal (blue dashed line).


