


Trend analysis (Fig. 1).
On Tuesday, if they are only testing the level 1.1005, then we can expect to work with the target 1.1041 the retracement level of 38.2% (blue dotted line). In lower work, the first lower target is the lower fractal 1.1005 (blue dashed line). If successful, the next lower target is 1.0990 - the next lower fractal (red dashed line).
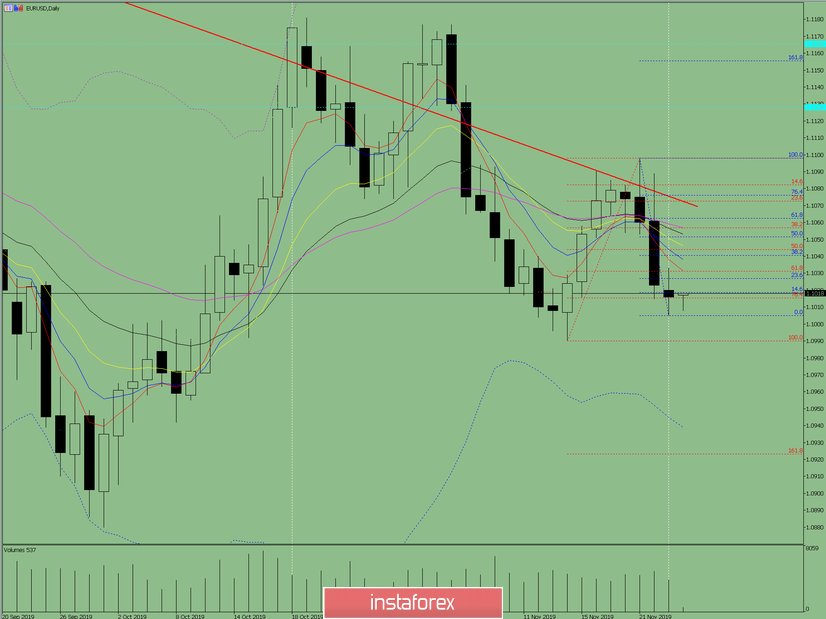
Fig. 1 (daily chart).
Comprehensive analysis:
- Indicator analysis - up;
- Fibonacci levels - up;
- Volumes - up;
- Candlestick analysis - up;
- Trend analysis - down;
- Bollinger Lines - up;
- Weekly schedule - up.
General conclusion:
On Tuesday, an upward movement is possible.
The first upper target 1.1041 is a retracement level of 38.2% (blue dashed line).
If successful, the next upper target 1.1052 is a pullback level of 50.0% (blue dashed line).
An unlikely but possible scenario is when a lower fractal is broken through 1.1005, a downward movement with a target recoils from 100.0% to 1.0990 (red dashed line).


