Yesterday was another stomping ground, with a continuing sluggish decline in the single European currency. It is also noteworthy that the attitude of market participants to the indices published by IFO was demonstrated yesterday. In turn, investors simply did not pay attention to them, as they simply do not understand what they actually reflect. But judging by the indicators, they showed some improvement. Thus, the indicator for assessing the current situation has grown from 97.8 to 97.9. while index of economic expectations has grown from 91.6 to 92.5. Well, the business optimism index rose from 94.7 to 95.0. That's just what these very indices reflect, no one understands. So it is not surprising that the market did not pay attention to such a significant increase in extremely important indicators.

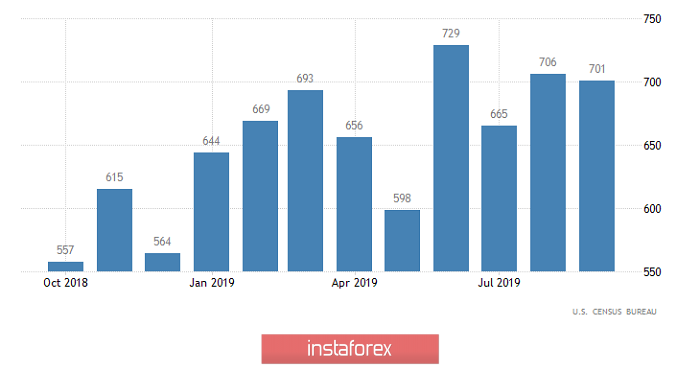
Today, the market should be at least a little more interesting, since the United States publishes data on sales of new homes, the volume of which may increase by 1.2%. If in the previous period 701 thousand new houses were sold, this number should be 709 thousand by now. In addition, S & P / CaseShiller data on housing prices are published, the growth rate of which is likely to accelerate from 2.0% to 2, 2% rise in housing prices, of course, gives reason to think about a possible increase in inflation. However, you need to understand that the share of real estate in the structure of this inflation is extremely small. In the bottom line, we will have a purely symbolic improvement in the US housing market, which will lead only to a slight strengthening of the dollar.
Primary Housing Sales (United States):

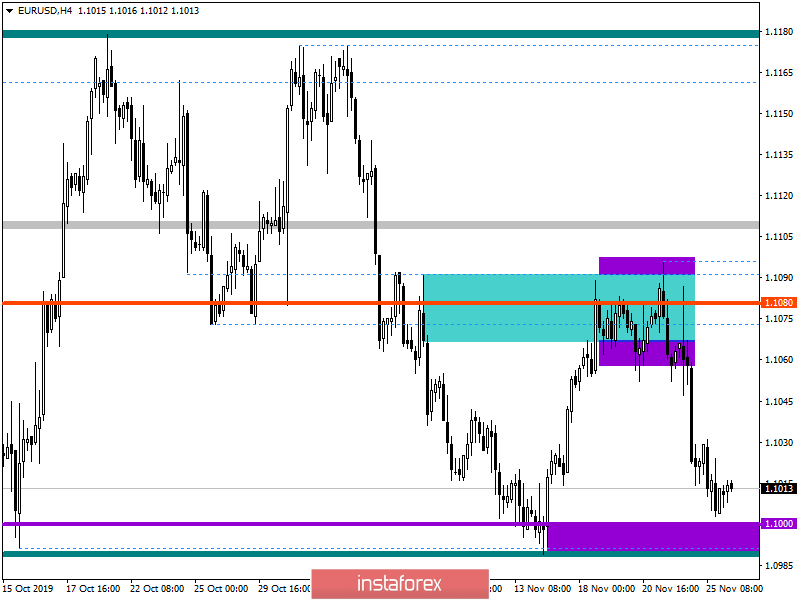
In terms of technical analysis, the EUR/USD currency pair confirmed to us what we wrote about in the previous hot forecast. The quote managed to maintain a downward interest, which led to a control rapprochement with the psychological level of 1.1000, after which, forming a chatter and signaling support. In fact, we have in some ways a repetition of the plot on November 12, where the quote already found a foothold, after which we change our mood to the stage of rebound, but in this case, we have an attempt to hold it. Now, let's see what this can lead to. In terms of a general review of the trading chart, we see the same correction within which these fluctuations occur. It is likely to assume that the psychological level of 1.1000 will put pressure on the quote, which will be reflected in the temporary chatter within it. Thus, the indicative range of fluctuations with respect to history can be in the region of 1.0990 / 1.1030, where you should carefully analyze the price fixing points before making a trading decision. We concretize all of the above into trading signals:
- We consider long positions in case of price fixing higher than 1.1035, not a puncture shadow.
- We consider short positions in case of price fixing lower than 1.0990, not a puncture shadow. From the point of view of a comprehensive indicator analysis, we see that indicator retain downward interest in relation to the main time intervals. In turn, the minute periods alternately glide on the existing stagnation.


