To open long positions on EURUSD you need:
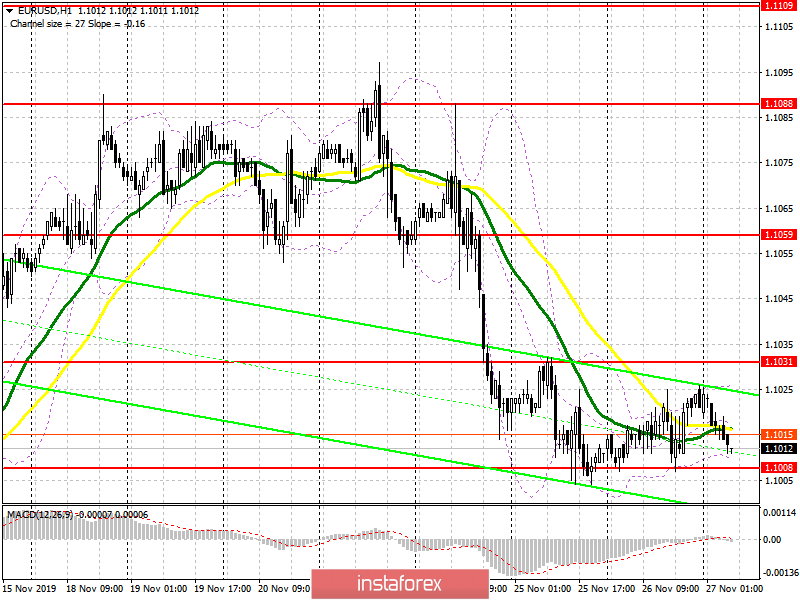
Yesterday's weak data on the US consumer confidence index did not make it possible for the bears to break below the support level of 1.1008, which will be emphasized today in the morning. All buyers' attention today will be focused on the resistance of 1.1031, since only consolidation above this level will lead to a larger upward correction to the areas of 1.1059 and 1.1088, where I recommend profit taking. However, it is hardly possible to count on such growth in the morning, as good news on the eurozone economy is not expected. Under the scenario of further downward movement, the bulls will do their best to cling to the support of 1.1008, however only the formation of a false breakout there will be a buy signal. Otherwise, it is best to open long positions on a rebound from a low of 1.0989.
To open short positions on EURUSD you need:
Bears tried to push support at 1.1008 several times yesterday, but this could not be done. A weak report on the US economy, namely, on the index of consumer confidence, did not allow this. On the contrary, news of progress in negotiations between the US and China supported the demand for the euro. The main task of the bears in the first half of the day is still the level of 1.1008, since only its breakthrough will lead to a new wave of decline in the euro with updating lows in the areas of 1.0989 and 1.0972, where I recommend profit taking. If there is no activity in the morning near the low of 1.1008, it is best to postpone the sale of the euro until the larger resistance at 1.1031 is updated, subject to a false breakout, or open short positions immediately to rebound from the high of 1.1059.
Signals of indicators:
Moving averages
Trade is carried out in the region of 30 and 50 moving average, which indicates the lateral nature of the market with an advantage on the side of euro sellers.
Bollinger bands
Only a breakthrough of the lower boundary of the indicator in the region of 1.1008 will provide sellers with the necessary forces, which will lead to another wave of a decline in the euro.

Description of indicators
- Moving average (moving average determines the current trend by smoothing out volatility and noise). Period 50. The graph is marked in yellow.
- Moving average (moving average determines the current trend by smoothing out volatility and noise). Period 30. The graph is marked in green.
- MACD indicator (Moving Average Convergence / Divergence - moving average convergence / divergence) Fast EMA period 12. Slow EMA period 26. SMA period 9
- Bollinger Bands (Bollinger Bands). Period 20


