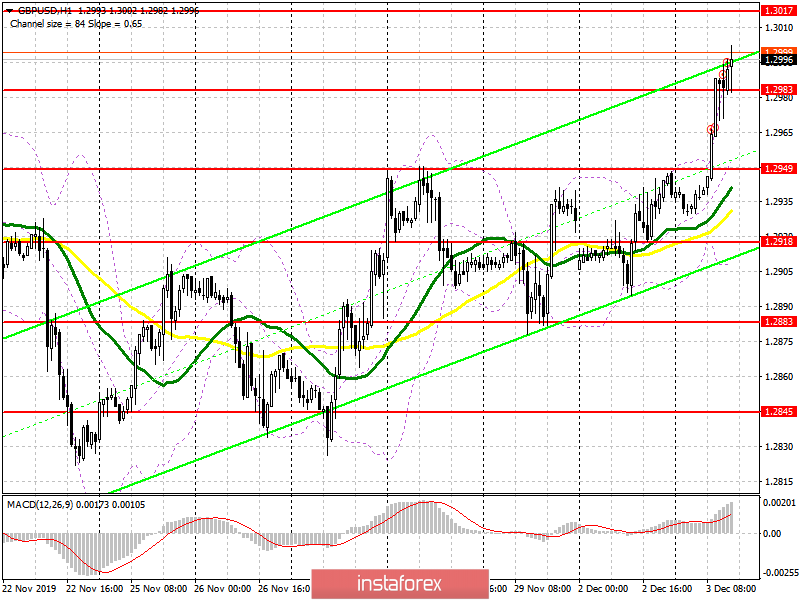
To open long positions on GBPUSD, you need:
Even in my morning review, I paid attention to the probability of breaking the resistance of 1.2949, which led to such powerful upward momentum. Now, buyers of the pound are trying to gain a foothold above the level of 1.2983, which the bears ignored and decided to concede. The main calculation is for a new maximum of 1.3017, where I recommend fixing the profits. If the pressure on the pound returns in the afternoon, you can expect to buy from the same level of 1.2949. The absence of important fundamental statistics for the US can play into the hands of buyers of the pound, so we cannot exclude the breakout of the maximum of 1.3017, which will lead GBP/USD to the resistance area of 1.3074.
To open short positions on GBPUSD, you need:
Sellers are in no hurry to return to the market after the demolition of several stop orders. Therefore, it is best to focus on the resistance of 1.3017, the formation of a false breakout on which will be a signal to sell the pound. Otherwise, it is best to sell GBP/USD on a rebound from 1.3074. The more important task of the bears will be the return of the pound under the support of 1.2983, which will precisely limit the upward potential and soon can lead to a decrease in the pair to the area of the minimum of 1.2949, from where the bulls will again begin their active purchases.
Indicator signals:
Moving Averages
Trading is above the 30 and 50 daily averages, indicating an upward trend.
Bollinger Bands
In the case of a decline in the pound, the average border of the indicator around 1.2949 will provide support.

Description of indicators
- Moving average (moving average determines the current trend by smoothing volatility and noise). Period 50. The chart is marked in yellow.
- Moving average (moving average determines the current trend by smoothing volatility and noise). Period 30. The chart is marked in green.
- MACD indicator (Moving Average Convergence/Divergence - convergence/divergence of moving averages). Fast EMA Period 12. Slow EMA Period 26. SMA Period 9.
- Bollinger Bands (Bollinger Bands). Period 20.


