


Bitcoin
On the weekly chart, the price had set above the falling line of the Fibonacci fan 61.8% with the clear intention of going over the resistance of the balance line, which will mark the shift of the price trend upwards.
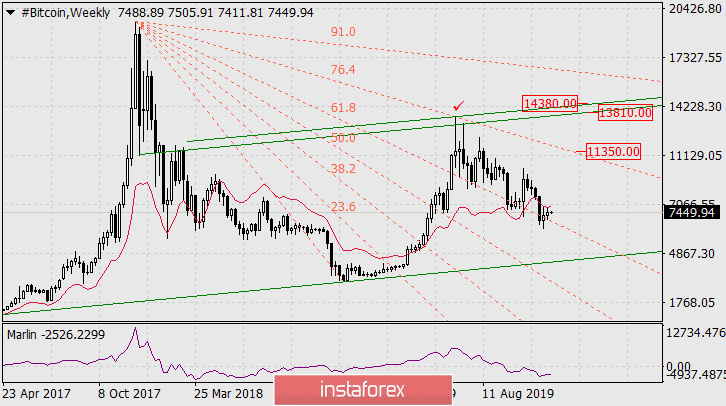
The first serious goal of bitcoin will be a Fibonacci beam of 76.4% around the price of 11350, and this beam is a trend line (more precisely, coincides with this line) along the peaks of December 2017 and June 2019 (marked with a tick) The exit above the resistance opens the second target in the range 13810-14380, formed by the strong trend lines of the green price channel at the peaks of July (13114) and June (13563) of 2019.
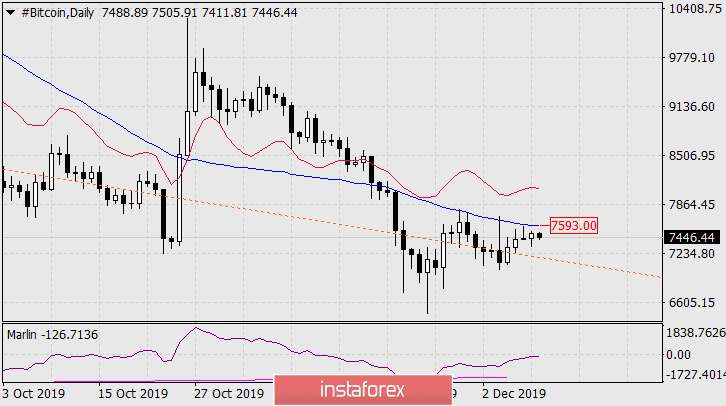 On the daily chart, a reversal convergence on the Marlin oscillator has formed. The signal line of the indicator appears to move into the zone of positive numbers. The price overcomes the resistance of the Kruzenshtern line (indicator blue). The price exit above the Kruzenshtern line (above 7593) will be a signal for purchases.
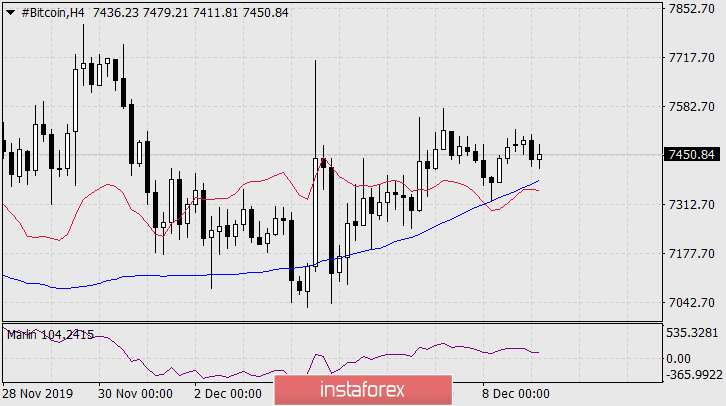 On the H4 chart, the trend is upward for all indicators.


