


To open long positions on EURUSD, you need:
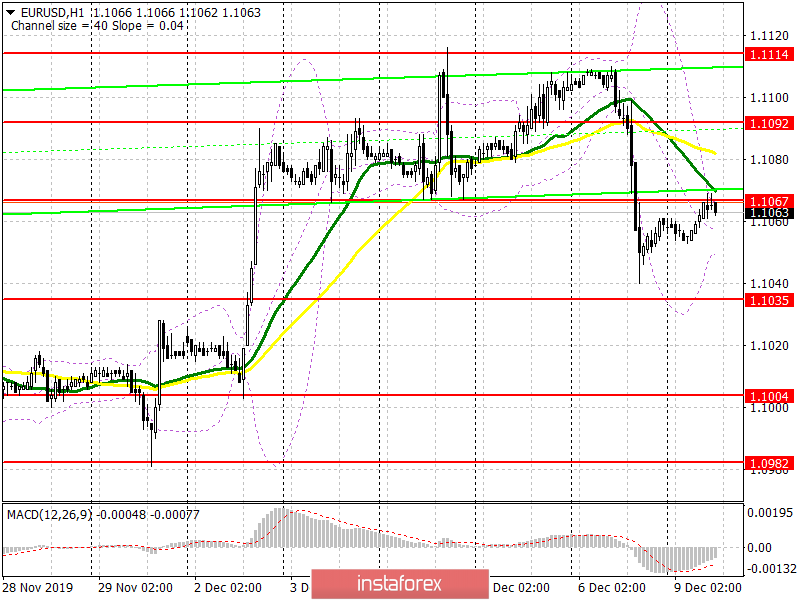
In the first half of the day, we could observe the growth of the euro in the area of resistance 1.1067, which I drew attention to in my morning forecast. The euro was supported by a good report on the German foreign trade balance, which managed to show growth in October this year. The task of buyers for the second half of the day is still the same return to the resistance level of 1.1067 since it depends on it whether the downward movement will continue or not. If the bulls fail to do this in the second half of the day, it is best to postpone purchases until the formation of a false breakout in the support area of 1.1035, but you can buy EUR/USD for a rebound only from the minimum of 1.1004. The breakout and consolidation of the euro above the resistance of 1.1067 will lead to a larger upward correction and return the pair to the area of the maximum of 1.1092, where I recommend taking the profits.
To open short positions on EURUSD, you need:
Bears have already formed a false breakout in the resistance area of 1.1067, which served as a signal to open short positions in the euro. While trading will be conducted below this range, you can expect a further decline in EUR/USD to the support area of 1.1035. However, only its breakdown will increase the pressure on the pair and allow sellers to reach the lows of 1.1004 and 1.0982, where I recommend fixing the profits. If the bears miss the level of 1.1067 in the second half of the day, and the release of important fundamental data that allow this to be done is not expected today, it is best to open short positions only after updating the resistance of 1.1092 or sell the euro from there immediately to rebound from the maximum of 1.1114.
Indicator signals:
Moving Averages
Trading is conducted below the 30 and 50 moving averages, which also limit the upward correction in the pair.
Bollinger Bands
Only a breakthrough of the upper limit of the indicator in the area of 1.1070 will ensure the growth of the euro.
Description of indicators
- Moving average (moving average determines the current trend by smoothing out volatility and noise). Period 50. The graph is marked in yellow.
- Moving average (moving average determines the current trend by smoothing out volatility and noise). Period 30. The graph is marked in green.
- MACD indicator (Moving Average Convergence / Divergence - Moving Average Convergence / Divergence). Fast EMA period 12. Slow EMA period 26. SMA period 9.
- Bollinger Bands (Bollinger Bands). Period 20.


