


Trend analysis (Fig. 1).
Today, the price may begin to move down with the first target 1.1108 which is the lower fractal. If this level is reached, there is a continuation to work down with the target 1.1098 which is equivalent to 21 average EMA presented in a black thin line.
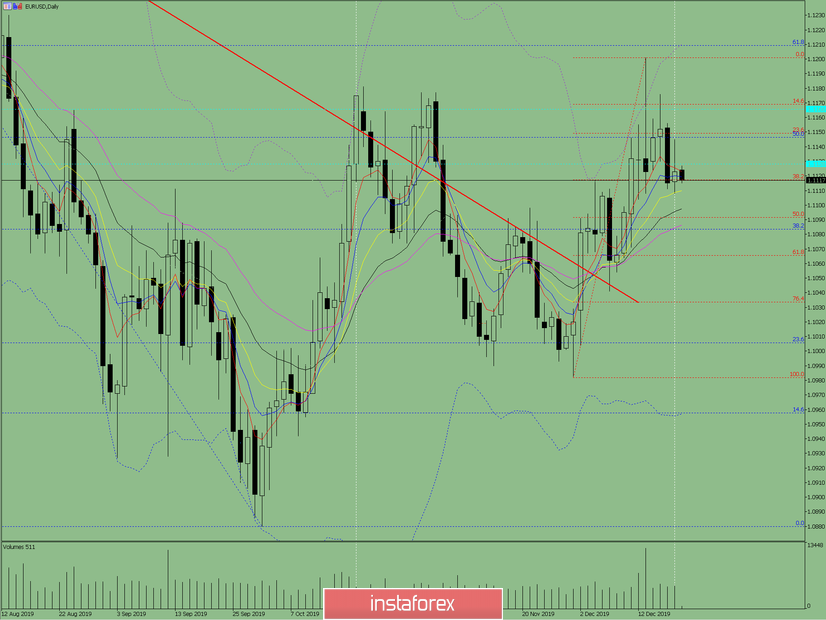
Fig. 1 (daily chart).
Comprehensive analysis:
- Indicator analysis - down;
- Fibonacci levels - down;
- Volumes - down;
- Candlestick analysis - down;
- Trend analysis - up;
- Bollinger Lines - up;
- Weekly schedule - up.
General conclusion:
A downtrend is possible on Friday.
An unlikely scenario is possible, which is, from a pullback level of 38.2% which is equivalent to 1.1117 presented in a red dashed line, the price will go up to the upper target 1.1146 the pullback level of 50.0% presented in a blue dashed line.


