


Hello, dear colleagues!
After the Christmas celebration, investors returned in a corresponding mood. Volatility is low, there are no drivers for good movements yet, the economic calendar is empty.
I usually write separate reviews for each currency pair. I looked at the charts and decided today to combine the euro/dollar and the pound/dollar in one article. I don't know what will happen, but I think it's worth a try.
EUR/USD
So, the technical picture for the main currency pair is perhaps the most uncertain. Since the beginning of this week, the euro/dollar has been consolidating in a narrow trading range. As a rule, after such consolidation, there is a good directional movement in one of the parties.
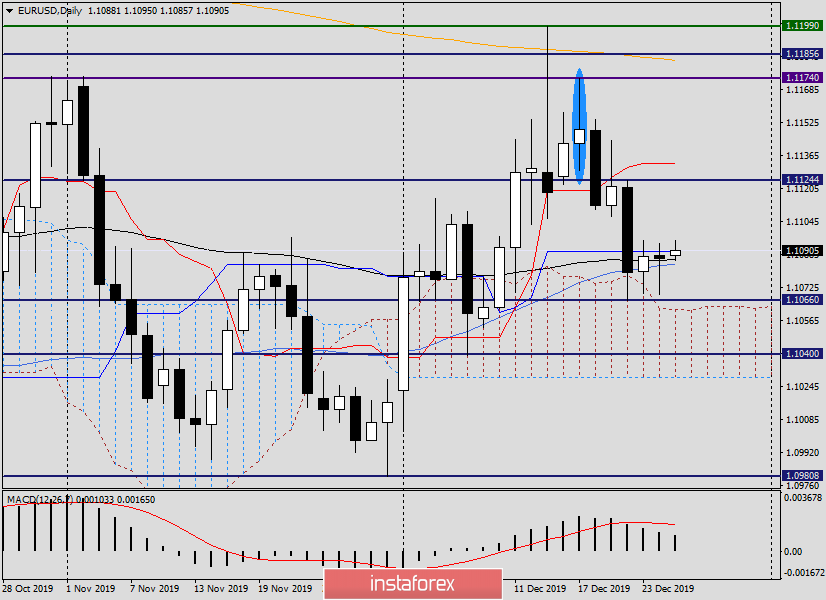
As seen on the daily chart, the lows of December 23 (1.1070) and the highs of the same day (1.1095) are currently benchmarks for further movement of the quote. The breakdown of support in the area of 1.1066 may trigger a decline to 1.1060, where the upper border of the Ichimoku indicator cloud passes. If the pair enters the cloud limits and gains a foothold there, I expect a decline to the support level of 1.1040 and the lower border of the Ichimoku cloud, which passes at 1.1029.
Characteristically, at the time of writing, EUR/USD is stuck near the Kijun line, as well as 89 exponential and 50 simple moving averages. In my opinion, the current situation is quite difficult for making trade decisions. There is too much uncertainty about the future direction of the course. In this regard, it is not necessary to exclude growth or its attempts, so it is necessary to indicate the goals of a possible correction.
If the pair rises, it will go to the highs on December 20 and the Tenkan line - this is the price zone of 1.124-1.1132. If this happens, you can look at the euro/dollar sales from the dedicated zone. Perhaps this is the main trading idea for the main currency pair of the Forex market. At least for now.
Those who want to buy should wait for the characteristic candle signals on the lower timeframes, in the price area of 1.1070-1.1040, and only after they appear open long positions in a pair.
GBP/USD
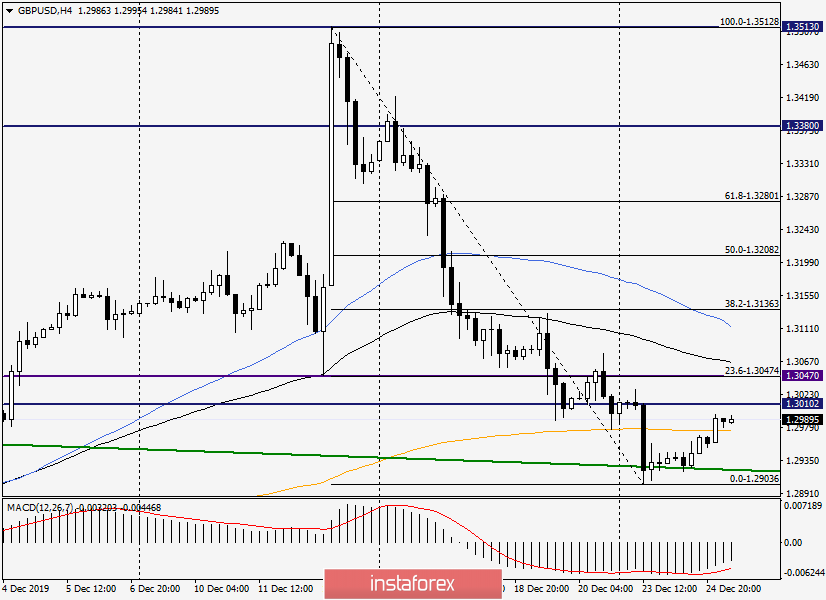
As for the pound, the situation is more definite. The pound/dollar pair has started a correction to its previous decline and will attempt to return above the important technical and psychological level of 1.3000. We will soon find out what will happen, but in the meantime, let's look for points for opening short positions on the pound on the H4 chart. Here I stretched the Fibonacci grid for a fall of 1.3513-1.2903. At the time of writing, the pair has passed a strong 233 exponential moving average on the rise and is trading higher. This may indicate a continuation of the corrective pullback to the area of 1.3047-1.3066, where the important technical and historical level of 1.3047, as well as 23.6 Fibo from the decline of 1.3513-1.2903 and 89 EMA.
It seems that sales from the selected area look very decent from a technical point of view. Even more convincing is the appearance of candle signals for a decrease in the designated area or near it.
At the same time, given the speculative and volatile nature of sterling, I do not rule out a deeper correction in the price zone of 1.3113-1.3136. Here are 50 simple moving average and 38.2 Fibo from the indicated fall.
Given that the current growth of the pair is corrective, as well as the fact that GBP/USD is trading under the symbolic level of 1.3000, purchases look riskier. However, those who wish can look at the opening of long positions when the pound falls in the price range of 1.2975-1.2965. In both cases, before opening positions, it would be good to see the confirming signals of the Japanese candlesticks. A thin market where any surprises are possible.
Good luck!


