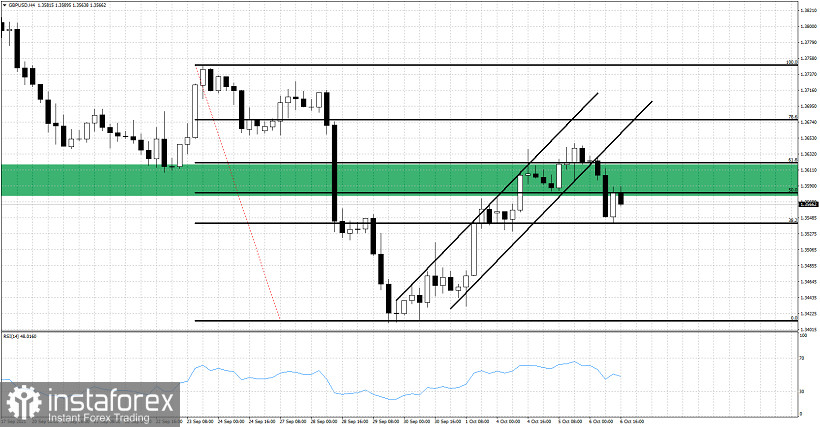
In our last post we saw GBPUSD trading above 1.3620 and the major Fibonacci resistance and the important horizontal resistance area. However at the end of the day bears made a comeback and price closed right at the resistance. Today price has provided a sign of weakness. What sign is that?

Green rectangle- resistance area
Black upward sloping lines - bullish channel
Black horizontal lines - Fibonacci retracement
GBPUSD has broken out of the bullish channel and got rejected at the horizontal resistance area and the 61.8% Fibonacci retracement. Bulls want to see price make a higher low and then break above the recent highs and stay above the green rectangle. Bears on the other hand are happy with the rejection at the Fibonacci resistance and the exit out of the channel. However in order to regain full control of the trend bears will need to push price below recent lows at 1.3410.


