


4-hour timeframe
Amplitude of the last 5 days (high-low): 45p - 37p - 59p - 26p - 25p.
Average volatility over the past 5 days: 39p (average).
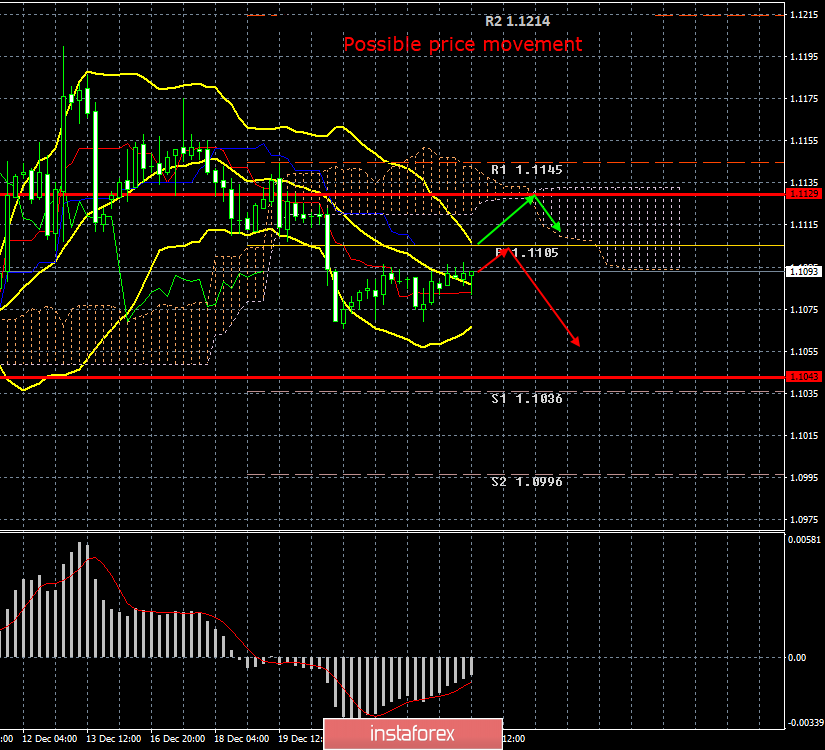
On Thursday, December 26, the EUR/USD currency pair continues to trade as boring and uninteresting as the last few days. Macroeconomic statistics are now zero integers, zero tenths, and the euro/dollar pair is doing its best to at least move. At the moment, an upward correction has begun and is continuing, of course, at very low volatility, and the critical Kijun-sen line may be worked out in the near future. However, even a rebound in quotes from this line cannot be considered a signal for selling under current conditions. The pair can safely go into full flat now or have already done so. In any case, whether the trend is moving now, whether it is corrective, lateral, with the current levels of volatility, it is extremely difficult to work in the market. According to the last five trading days, the average volatility is 39 points, but in fact, it has not exceed 26 points since the beginning of this week.
From the positive news (due to the very fact of their presence on an empty general fundamental background), one can note the statement by US Treasury Secretary Stephen Mnuchin that the parties (China and the US) will soon sign the agreement in the first phase . Actually, that's all and there is absolutely nothing new in this news, since the information that the parties are preparing to sign a trade agreement has been known for a long time.
It also appeared that China officially protests to the United States over some restrictions on Chinese companies that were adopted in the US defense budget for 2020. The PRC Ministry of Commerce notes that the United States are tightening sanctions against Chinese companies, although they should not seem to aggravate the situation between the countries against the background of the signing of a trade agreement soon. According to the Chinese side, the United States continues to intervene in domestic Chinese affairs, now in commercial activities. Actually, there is no fundamentally new information. China regularly protests in response to various US actions that interfere with China's internal affairs. Recall, just recently, China protested against the adoption by the US Congress of two laws, which are also regarded as interference in the internal affairs of China. We are talking about Uyghur and Hong Kong laws. However, as we see, these protests do not prevent Beijing and Washington from continuing to conduct dialogue on the terms of trade between the countries.
In addition to these two news, there is absolutely nothing to report from a fundamental point of view. Traders can only continue to wait for the completion of the low volatility flat, and most likely it will end no earlier than the first days of the new, 2020. In this regard, it is not recommended to trade the pair that passes 20-25 points per day.
Trading recommendations:
The EUR/USD pair continues to adjust. Thus, short positions with the target support level of 1.1043 remain relevant, but after the rebound the price is from the Kijun-sen line. It is recommended to buy the pair no earlier than when the bulls consolidate above the Kijun-sen line with the first goal of the resistance level of 1.1145, however, with minimal lots. Given the low volatility in recent days, it would not be the worst option to not open new positions.
Explanation of the illustration:
Ichimoku indicator:
Tenkan-sen is the red line.
Kijun-sen is the blue line.
Senkou Span A - light brown dotted line.
Senkou Span B - light purple dashed line.
Chikou Span - green line.
Bollinger Bands Indicator:
3 yellow lines.
MACD indicator:
Red line and bar graph with white bars in the indicators window.
Support / Resistance Classic Levels:
Red and gray dotted lines with price symbols.
Pivot Level:
Yellow solid line.
Volatility Support / Resistance Levels:
Gray dotted lines without price designations.
Possible price movement options:
Red and green arrows.


