


In December, the price moved up, broke through the resistance line of the downward channel of 1.3287 (black thick line) and reached the retracement level of 61.8% - 1.3451 (blue dotted line). After testing the pullback level of 61.8%, the pair went quite far down and closed below the resistance line of 1.3287.
Trend analysis.
In January, it is possible to move up with the target of 1.3514 - the upper fractal (red dotted line). If this level is overcome, the next top target is a pullback level of 76.4% - 1.3759 (blue dotted line).
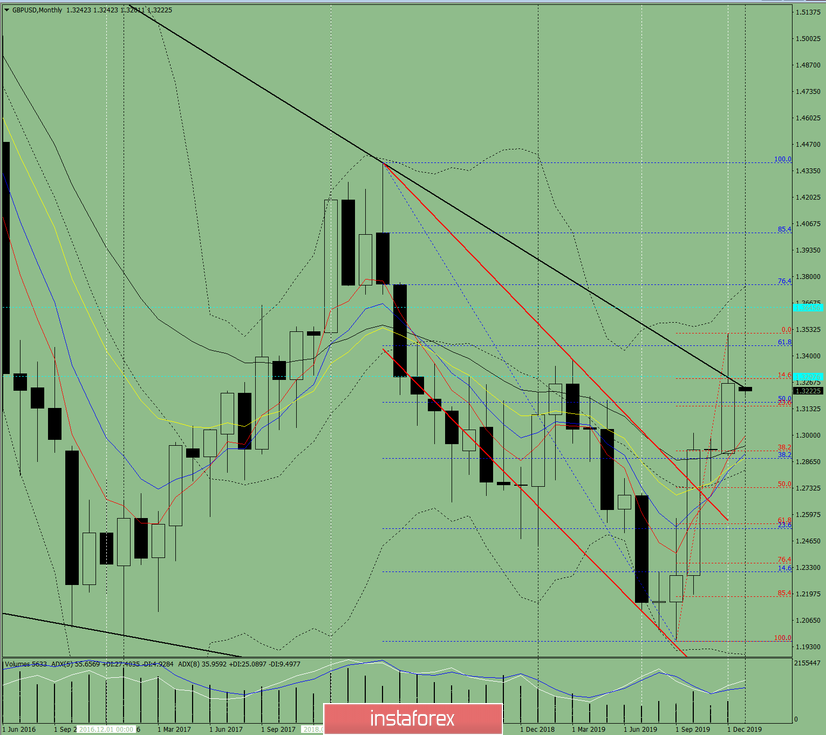
Fig. 1 (monthly chart).
Indicator analysis:
- Indicator analysis - up;
- Fibonacci levels - up;
- Volumes - up;
- Technical analysis - down;
- Trend analysis - up;
- Bollinger lines - up;
The conclusion on complex analysis - the upper hand is possible.
The overall result of calculating the candle of the GBP/USD currency pair according to the monthly chart: the price will most likely have an upward trend with the absence of the first lower shadow (first week of the month - white) and the absence of the second upper shadow (last week - white).
The upper target is 1.3514 - the upper fractal (red dotted line). If this level is overcome, the next top target is a pullback level of 76.4% - 1.3759 (blue dotted line).
An unlikely scenario - from the level of 1. 3235 resistance line (black bold line) downward movement with a target of 1.2919 - 38.2% pullback level (red dotted line).


