


After the $1.90 low on September 22, Cardano has made no real progress to the upside or to the downside. Price is moving up and down in a tightening range and has formed a triangle pattern. The more times the triangle boundaries are tested, the more valid a possible signal will be.
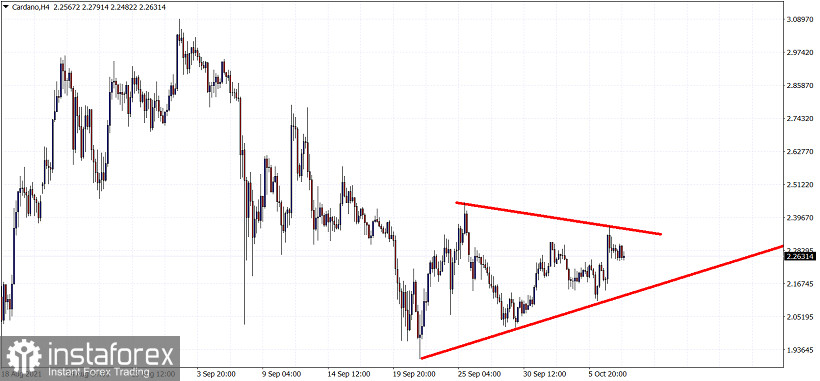
Cardano is now trading around $2.26. Recently price tested the lower triangle boundary at $2.10 and then the upper boundary at $2.36. These two price levels provide us with important information. Price will continue to trade sideways as long as price does not break either of the two levels. If price breaks above $2.36 we will get a bullish signal and price could continue higher towards $2.80-$3. If the lower triangle boundary is broken, we should expect new multi week lows for Cardano towards $1.60.


