


To open long positions on GBP/USD, you need:
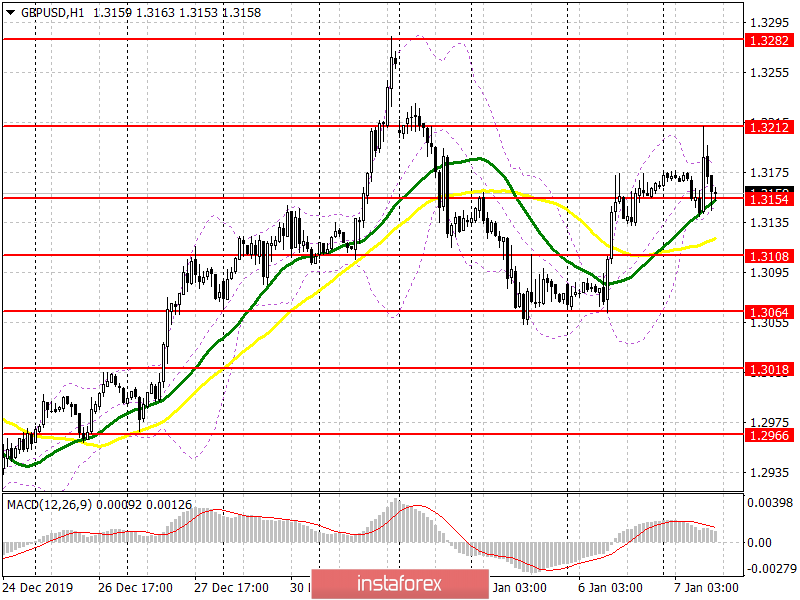
Even in the morning forecast, I paid attention to the level of 1.3212, which depended on the further bullish direction of the market. As we can see on the chart, it was not possible to break through the first time above this range, and its test, on the contrary, led to a return to the market of large sellers of the pound. At the moment, as in the morning, the bulls again need to protect the support of 1.3154, and only the formation of another false breakout at this level will be a signal to open long positions in the pound. The same task of the bulls remains the maximum of 1.3212, the breakthrough of which will provide a direct road to the area of 1.3282 and 1.3348, where I recommend fixing the profits. If the pair declines further and a breakdown of the support of 1.3154, it is best to count on new purchases of GBP/USD only after testing the lows of 1.3108 and 1.3064.
To open short positions on GBP/USD, you need:
Sellers have made clear their presence in the area of 1.3212, and now they will try to push the pair below the support of 1.3154, as it depends on the further direction of the pound. Only fixing below this range will help the bears to break under the moving averages and regain the location of the market, which will lead to an update of the lows of 1.3108 and 1.3064, where I recommend taking the profits, as this range will be actively protected by buyers. If demand for the pound returns in the second half of the day, the optimal level for opening short positions will remain a maximum of 1.3212, where the formation of a false breakout will be a signal to sell. Immediately on the rebound, I recommend selling GBP/USD only from the area of 1.3282, which is the maximum on December 31 last year.
Indicator signals:
Moving Averages
Trading is just above the 30 and 50 daily averages, indicating clear problems for buyers of the pound.
Bollinger Bands
Only a break of the upper border of the indicator in the area of 1.3185 will allow us to count on a larger upward movement.
Description of indicators
- Moving average (moving average determines the current trend by smoothing out volatility and noise). Period 50. The graph is marked in yellow.
- Moving average (moving average determines the current trend by smoothing out volatility and noise). Period 30. The graph is marked in green.
- MACD indicator (Moving Average Convergence / Divergence - Convergence / Divergence moving average) Fast EMA Period 12. Slow EMA Period 26. SMA Period 9
- Bollinger Bands (Bollinger Bands). Period 20


