


Good day!
Recently, the Swiss franc has become increasingly associated with a protective asset and is again perceived as a safe- haven currency. However, those who are not the first year in the market, know and remember that after large-scale interventions of the Swiss National Bank (SNB) in 2011 and 2015, Swiss simply began to avoid, or rather avoid.
Investors are wary of buying the Swiss currency, bearing in mind the possible interference in the course of trading of the SNB to prevent the strengthening of its national currency. In this regard, it is difficult to consider the franc as a fully protective asset, but such functions remain with swiss, though to a much lesser extent.
The same can be said about the correlation of the currency pairs EUR/USD and USD/CHF, which have been moving in the opposite direction for a long time. This is no longer so obvious now, although elements of correlation remain to this day.
Weekly
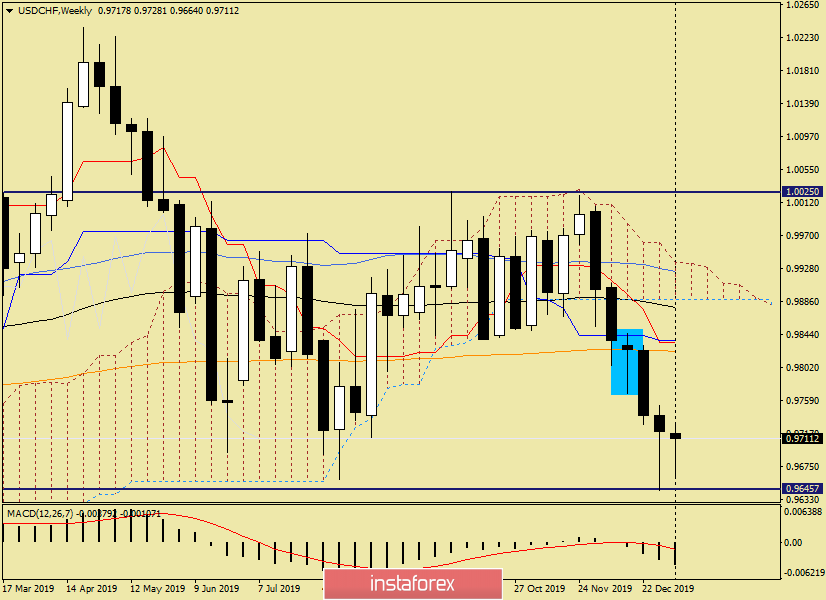
Interesting picture. As you can see, after the circled bullish candle, I expected the rate to rise, but the market judged differently and the decline continued.
Last week, a similar candle with bullish overtones appeared, and again the price moved down. However, the previous highs were not rewritten, and the pair began an active recovery. At the time of writing, almost all losses are leveled, and the pair is trading near the opening price of weekly trading. There is still more than enough time before the end of the session, besides the main trading events of January 6-10 are still ahead. Let me remind you that on Friday, January 10, the most important reports on the US labor market will be released, which will determine the closing price of the current five-day period.
Nevertheless, it seems that all the goals at the bottom have already been achieved and the USD/CHF rate will move up. If so, the targets will be the previous highs at 0.9753, the census of which will open the way to 0.9770-0.9790 and 0.9800-0.9820.
If the downward scenario is resumed, the nearest target will be the support of 0.9645, where the further direction of the course will be decided.
Daily
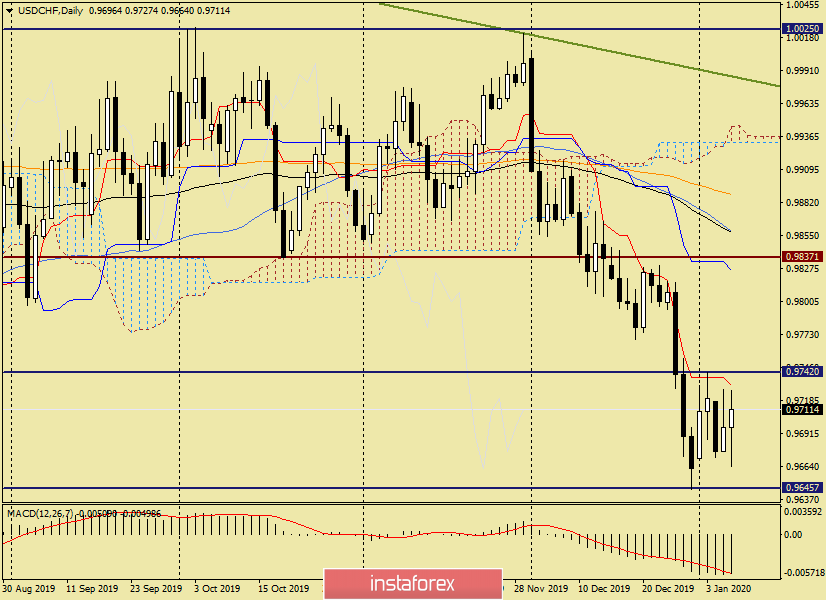
As seen on the daily chart, the stumbling block for the continuation of the upward trend is the Tenkan line of the Ichimoku indicator, which is located at 0.9731. However, in addition to the Tenkan breakout, the USD/CHF bulls need to overcome the resistance of sellers at 0.9742. Only a true breakout of this level with a mandatory fixing above will indicate a bullish mood of the dollar/franc. If this happens, the road will open to the area of 0.9800-0.9820, where you can see a strong technical zone.
In my opinion, the most optimal scenario looks bullish, but to make sure, you need to wait for the breakdown of the level of 0.9742.
H4
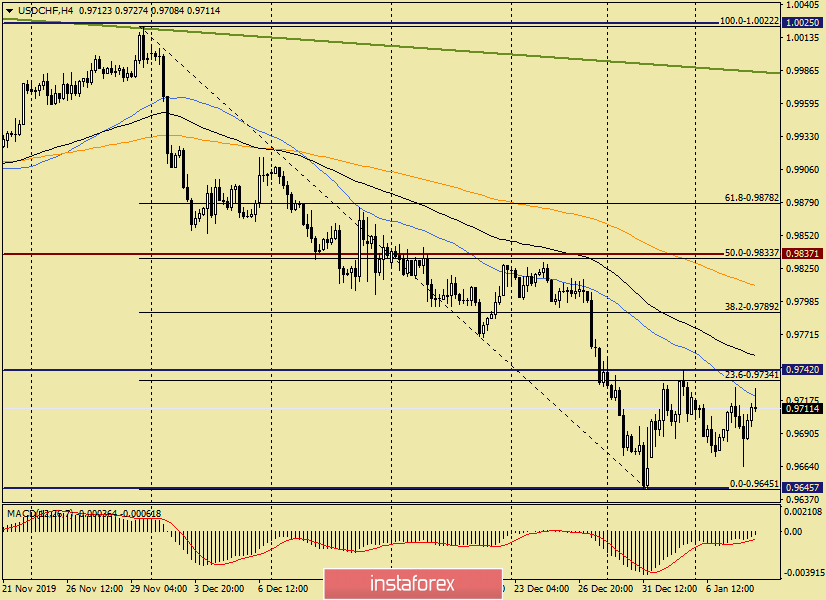
At the moment of completion of the review, the pair tests a simple moving average for the breakdown 50, on the passage of which the further prospects of the instrument will depend.
A breakdown of 50 MA will send the quote to the levels of 0.9754, 0.9789, and 0.9811. Short-term sales may be relevant from each of these levels. However, the main trading idea, in my opinion, looks like buying with a decrease in the price range of 0.9710-0.9700. There is a very strong and significant technical zone here, from where the USD/CHF exchange rate has repeatedly unfolded.
Good luck!


