


To open long positions on GBPUSD, you need:
In the morning forecast, I focused on the support of 1.3055, which was the lower border of the side channel. Its breakdown, which took place today after the speech of the head of the Bank of England, may indicate the advantage of sellers of the pound. However, the bulls still have a chance that they can take advantage of it in the afternoon. To do this, it is necessary to close the North American session above the resistance of 1.3066, which from a technical point of view will return the location of the market to buyers. Only in this scenario, you can expect the growth of GBP/USD in the area of highs of 1.3129 and 1.3206, where I recommend fixing the profit. An equally important task will be to hold the support of 1.3015, which the bears have already tested. Given the lack of activity at this level, only the formation of a false breakout on it will be a signal to buy. Otherwise, it is best to open new long positions after updating the lows of 1.2971 and 1.2904.
To open short positions on GBPUSD, you need:
Sellers coped with the morning task and achieved the breakdown of the support of 1.3055, which is now transformed into the resistance of 1.3066. The formation of a false breakout on it in the second half of the day will be an additional signal to open short positions in the pound in the expectation of a repeated decline and a breakdown of the minimum of 1.3015, near which the main trade is currently being conducted. Fixing below this range will push GBP/USD even lower in the area of 1.2971 and 1.2904, where I recommend taking the profits. If the bulls are stronger than the sellers, and this can happen only after the vote in the UK Parliament on the Brexit bill, a return to the level of 1.3066 will lead to an increase in the pound. In this scenario, it is best to expect sales after the update of the maximum of 1.3129, or a rebound from the more powerful resistance of 1.3129.
Indicator signals:
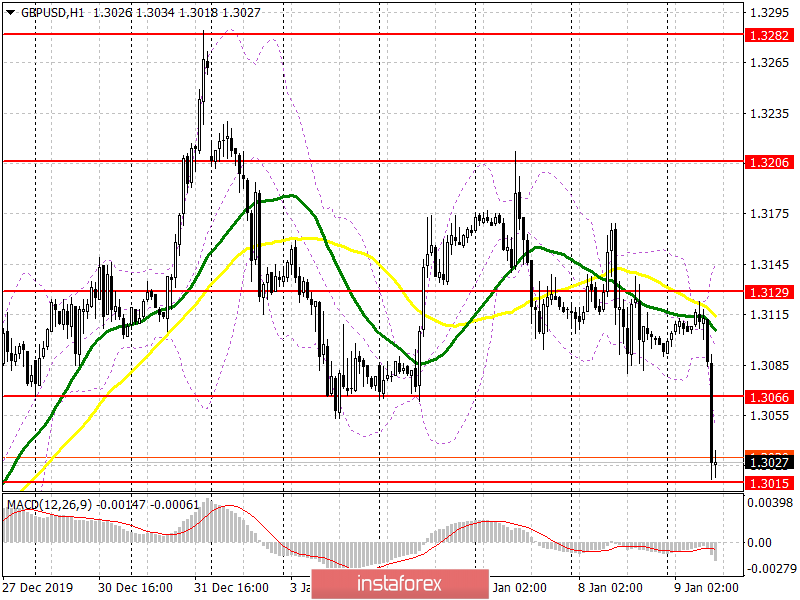
Moving Averages
Trading is conducted below the 30 and 50 moving averages, which indicates the advantage of sellers of the pound.
Bollinger Bands
In the case of an upward correction, the average border of the indicator around 1.3100 will act as a resistance.
Description of indicators
- Moving average (moving average determines the current trend by smoothing out volatility and noise). Period 50. The graph is marked in yellow.
- Moving average (moving average determines the current trend by smoothing out volatility and noise). Period 30. The graph is marked in green.
- MACD indicator (Moving Average Convergence / Divergence - Moving Average Convergence / Divergence). Fast EMA Period 12. Slow EMA Period 26. SMA Period 9.
- Bollinger Bands (Bollinger Bands). Period 20.


